


Leaderboard
-
Lady Elanore
FREEDOM19Points24,878Posts -

EnterName
Resident Member18Points3,798Posts -
.jpg.1006585dfe4e2977315b67c3d642e37b.jpg)
Guest_
FREEDOM15Points83,824Posts -
MikeTheThinker
FREEDOM10Points8,484Posts


Popular Content
Showing content with the highest reputation on 21/10/24 in Posts
-
MOT completed today, another clean bill of health!4 points
-
Cant believe how good the mud flaps are at keeping my car cleaner than normal considering the weather. First time I have had them fitted on any of my cars but now would be the first thing I have fitted3 points
-
2 pointsUnless the coolant has become contaminated again - or incorrect coolant has been used, there shouldn't be any staining of the tank.2 points
-
11-4-2017 at 10301 4-10-2017 at 36439 26-9-2018 at 20837 as well. Thanks. AG Falco2 points
-
2 pointsTBH the key not recognised part could have been as simple as a the sensor loop on the key barrel playing up. Id start by getting the diagnostics scanned and seeing if that's the issue before anything else and certainly before starting to swap out ECUs, clocks, key barrels etc.2 points
-
2 pointsSounds like a good plan to replace the cap first. Make sure the replacement is genuine OEM quality.2 points
-
2 points
-
2 points
-
2 pointsKeir Starmer MP / PM can get some Ex Tory MP / Minister enrolled to look into it. After all no manufacturer / importer for the manufacturers wants to pay a £15,000 penalty on every car sold / First Registered because they never meet the 22% Target with their cars or the partners. Whatever way they manipulate First Registrations this year they are up sh!t creak next year.2 points
-
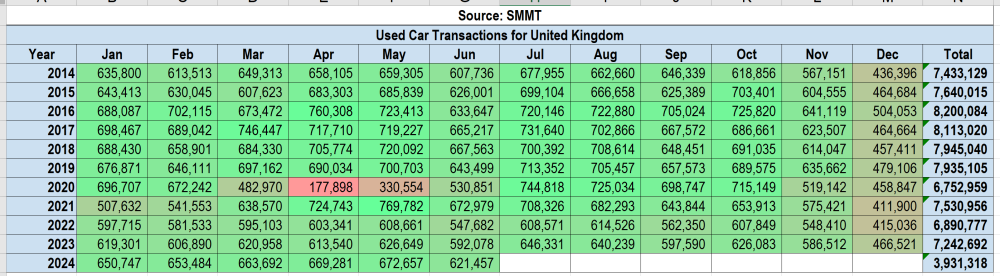
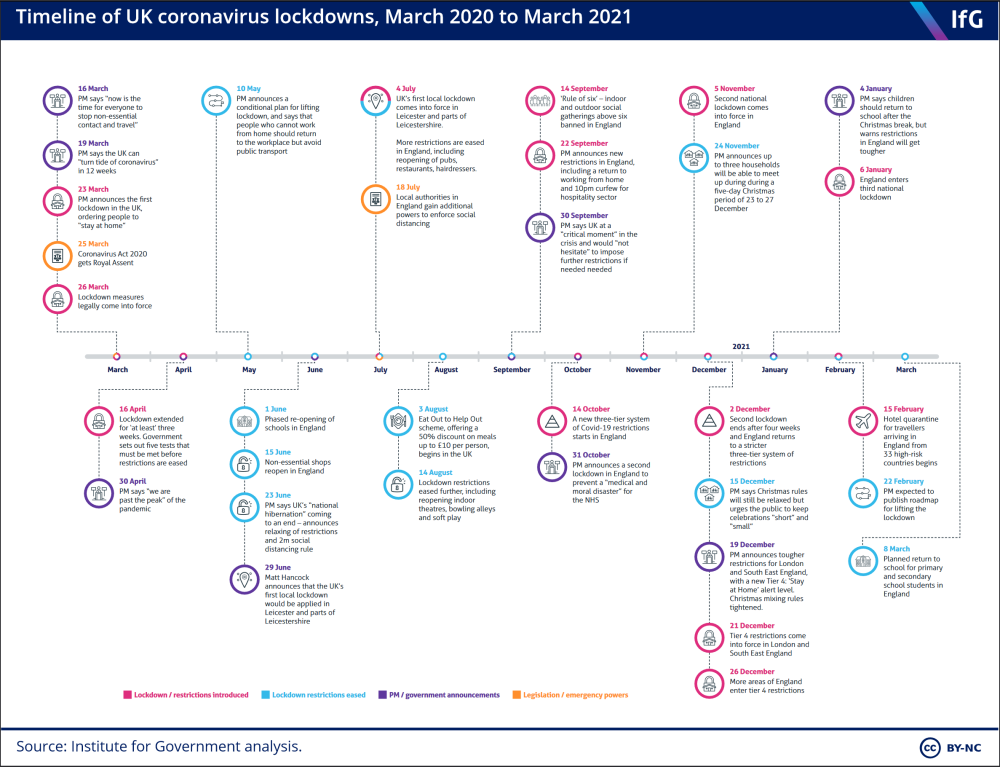
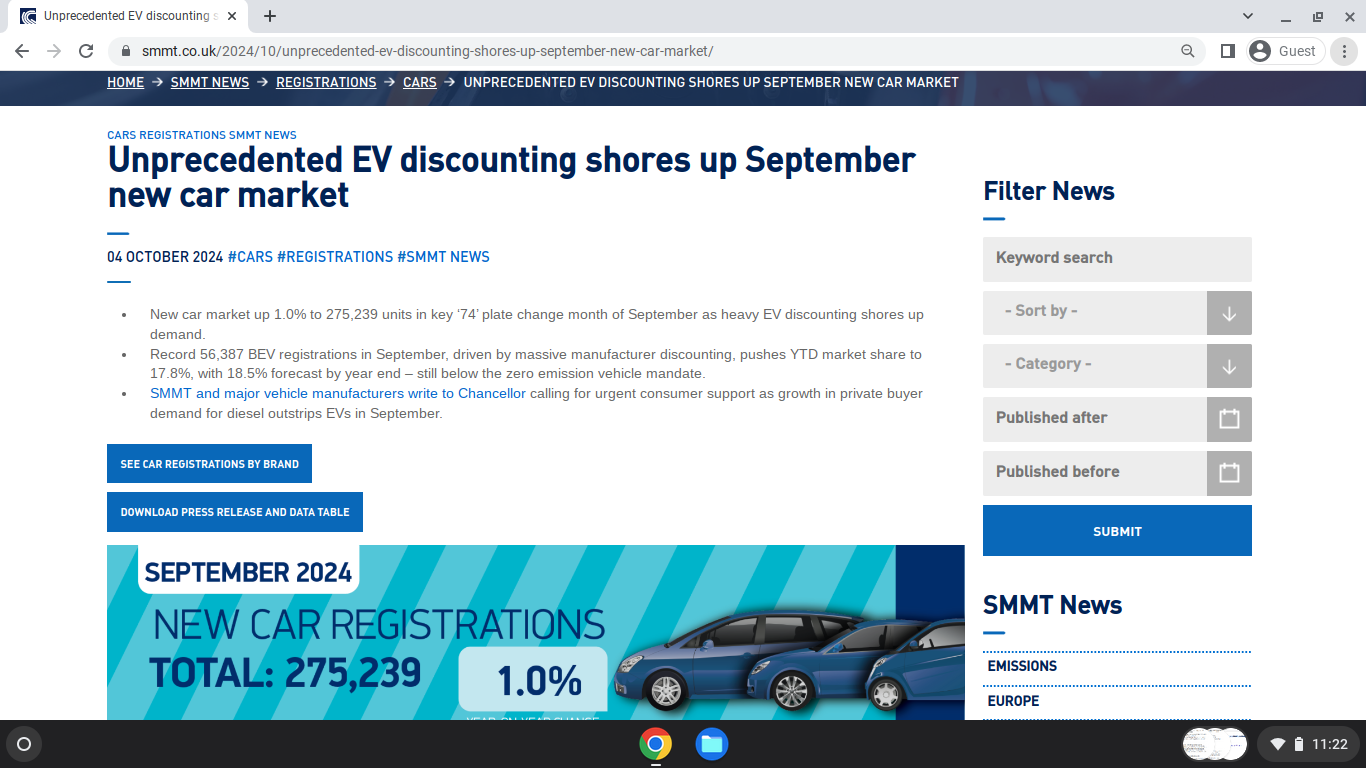
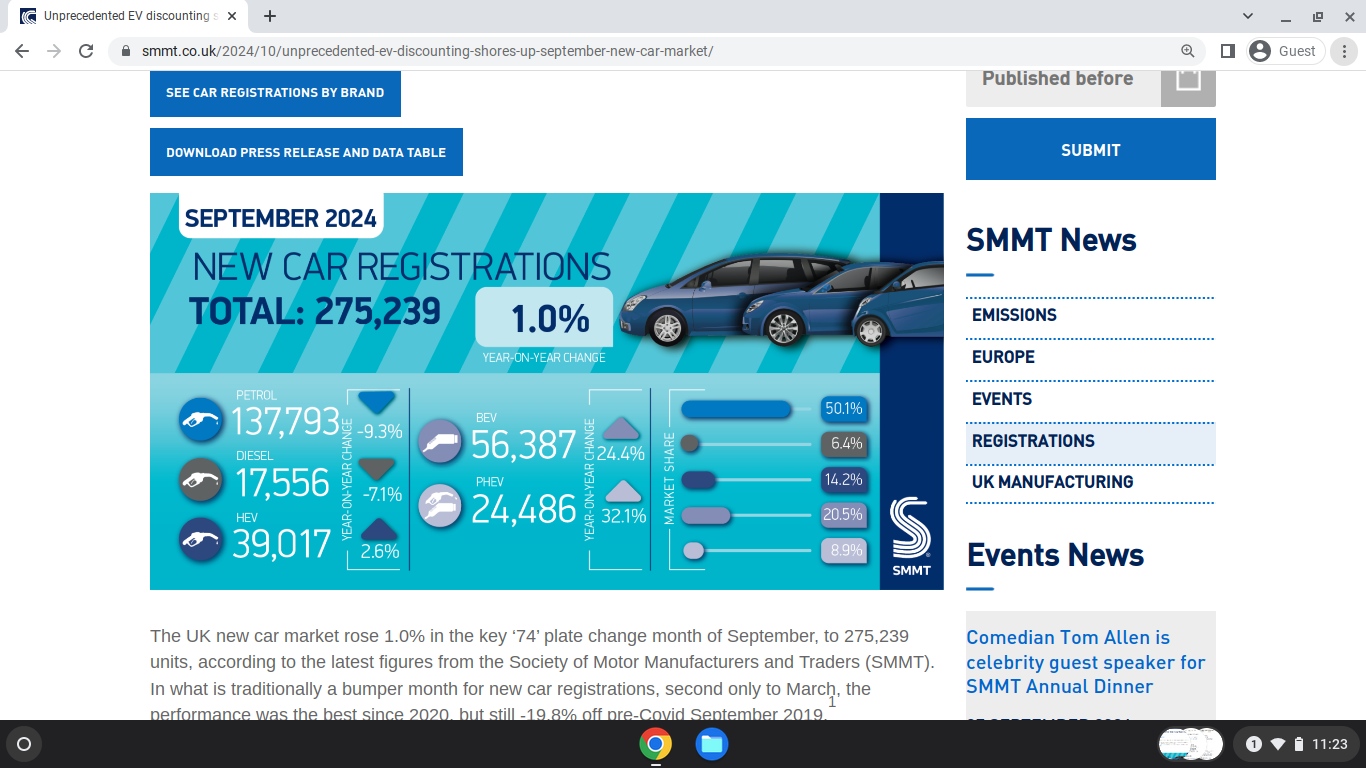
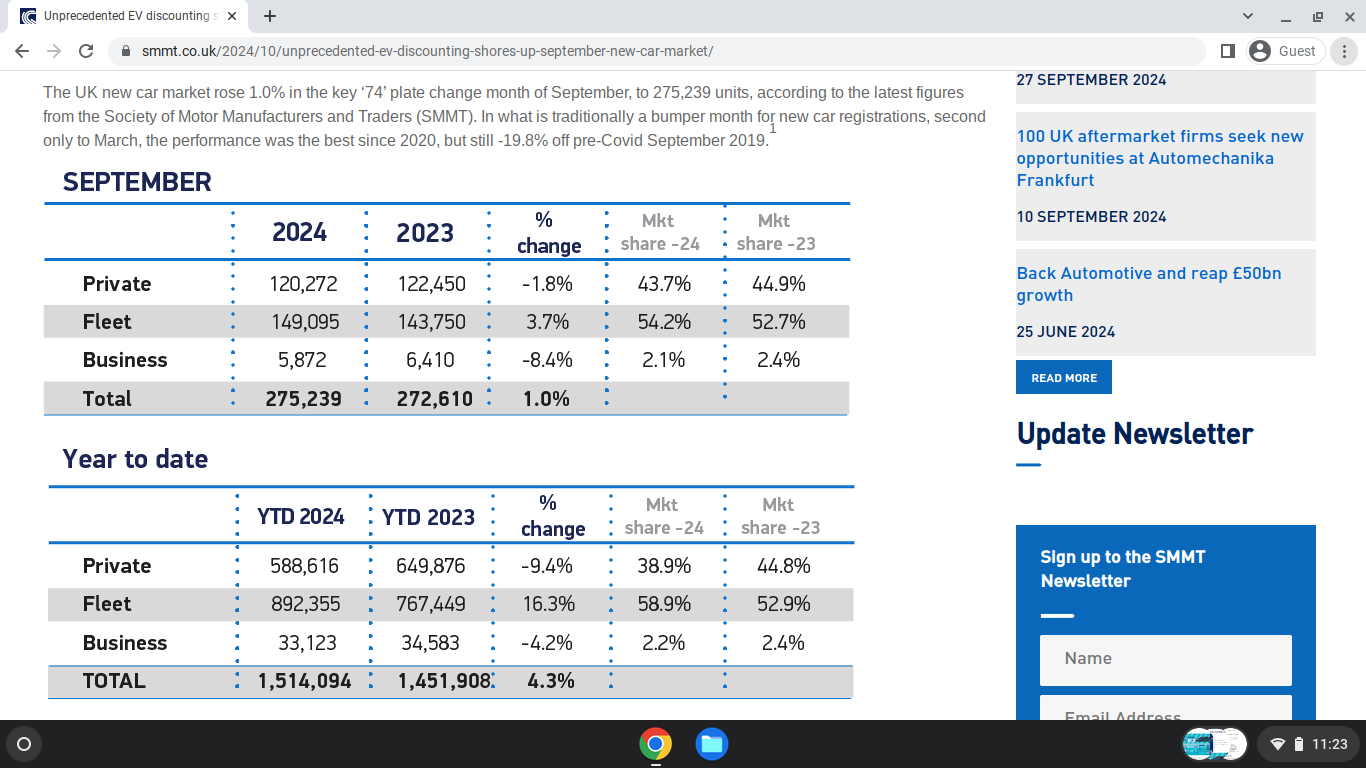
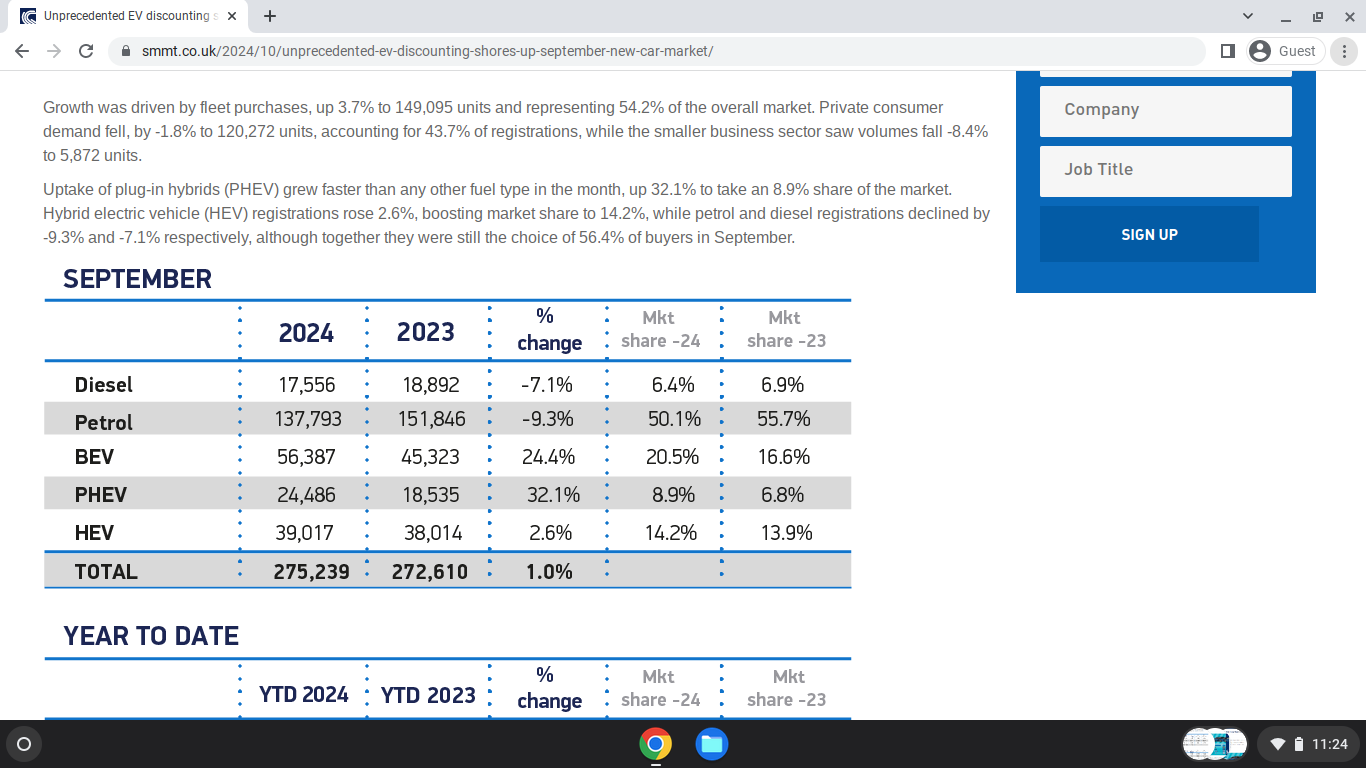
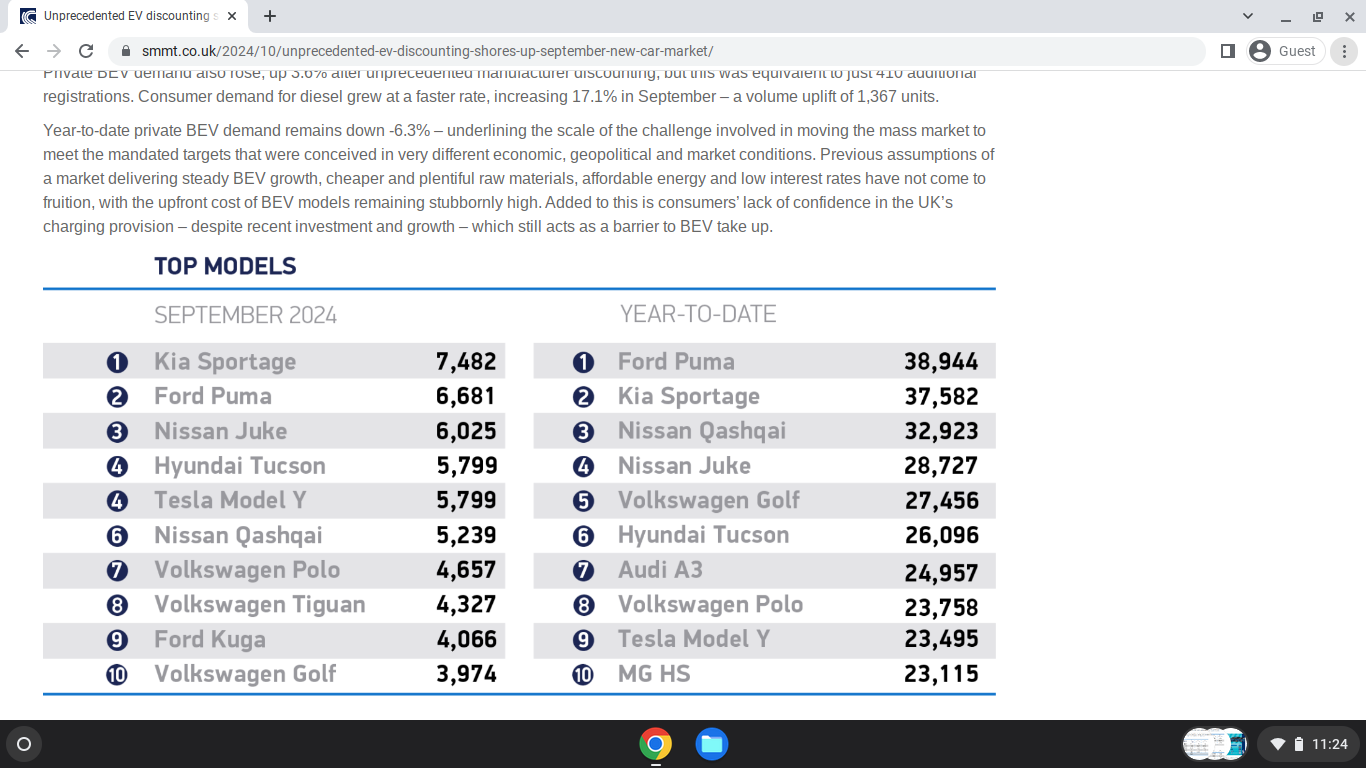
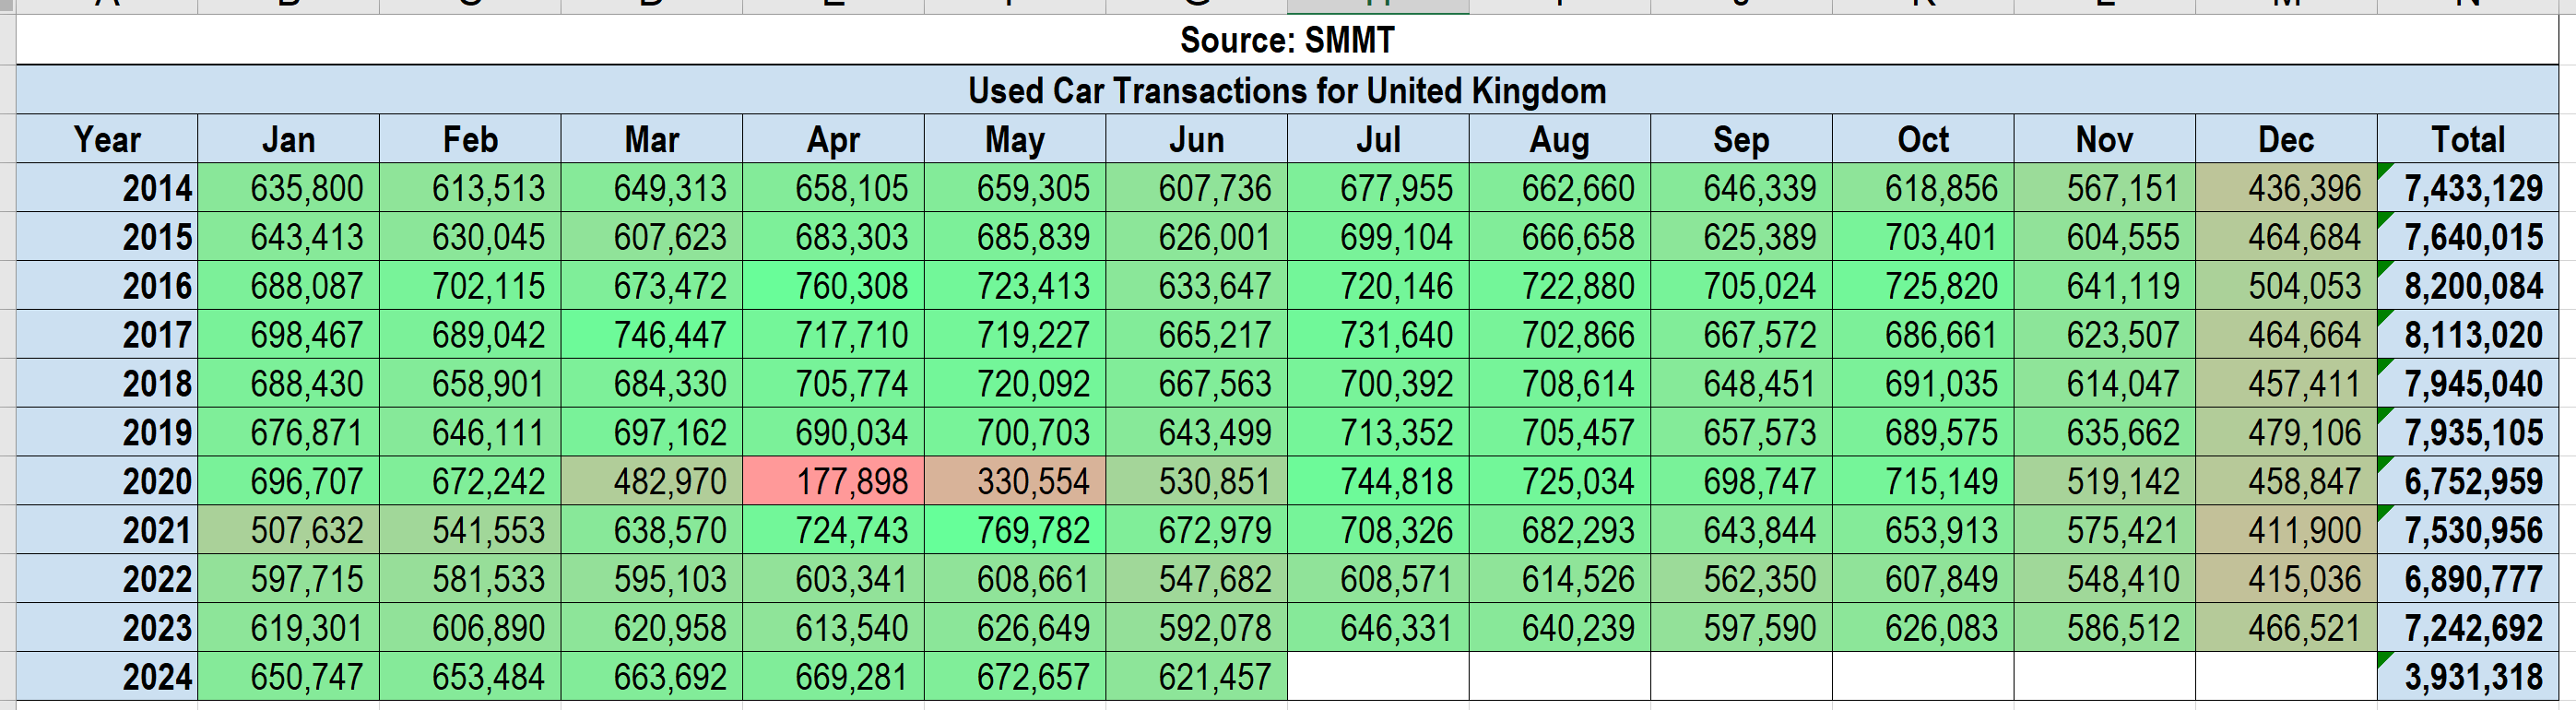
2 pointsIncidentally, I've been watching Barrie Crampton videos and have been looking for data to confirm/deny his claim that there's some sort of EV sales bubble going on, due to pre-registration of EVs, which he claims are a deliberate attempt to artificially boost sales to meet EV sales quota targets. I found myself on the SMMT website which provides the following data. https://www.smmt.co.uk/2024/08/used-car-sales-q1-2024-2/ I popped the data into Excel, applied a little conditional formatting colour magic, and below is the result. The low figure for red shading I used was 100,000 and the high figure for green shading was 1,000,000. So the lower the sales are in a given month, the more red the sales box is shaded, and the higher the sales are in a given month, the more green the box is. I expected to see a greater impact on car sales in the UK in 2020, especially when you compare them with sales in 2022 when there was no lockdown. (Lockdown timeline https://www.instituteforgovernment.org.uk/sites/default/files/timeline-lockdown-web.pdf)
 2 points
 -
2 pointsThese only use a 0,5mm wire for the tv tuner so no more than 7 amps of current draw. The radio itself will draw more power than the TV tuner. Ive had the tv tuner on for an hour with the car off without issues.2 points
-
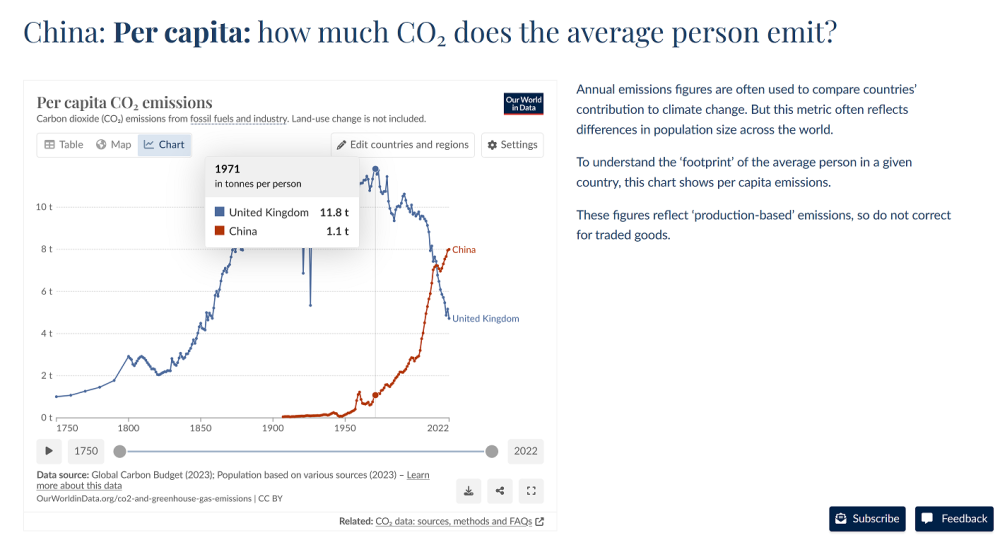
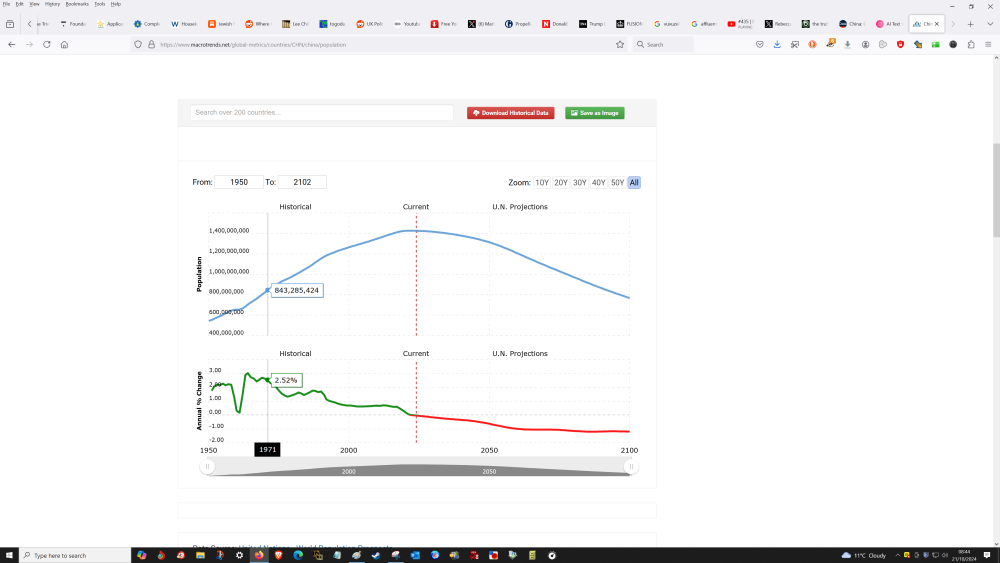
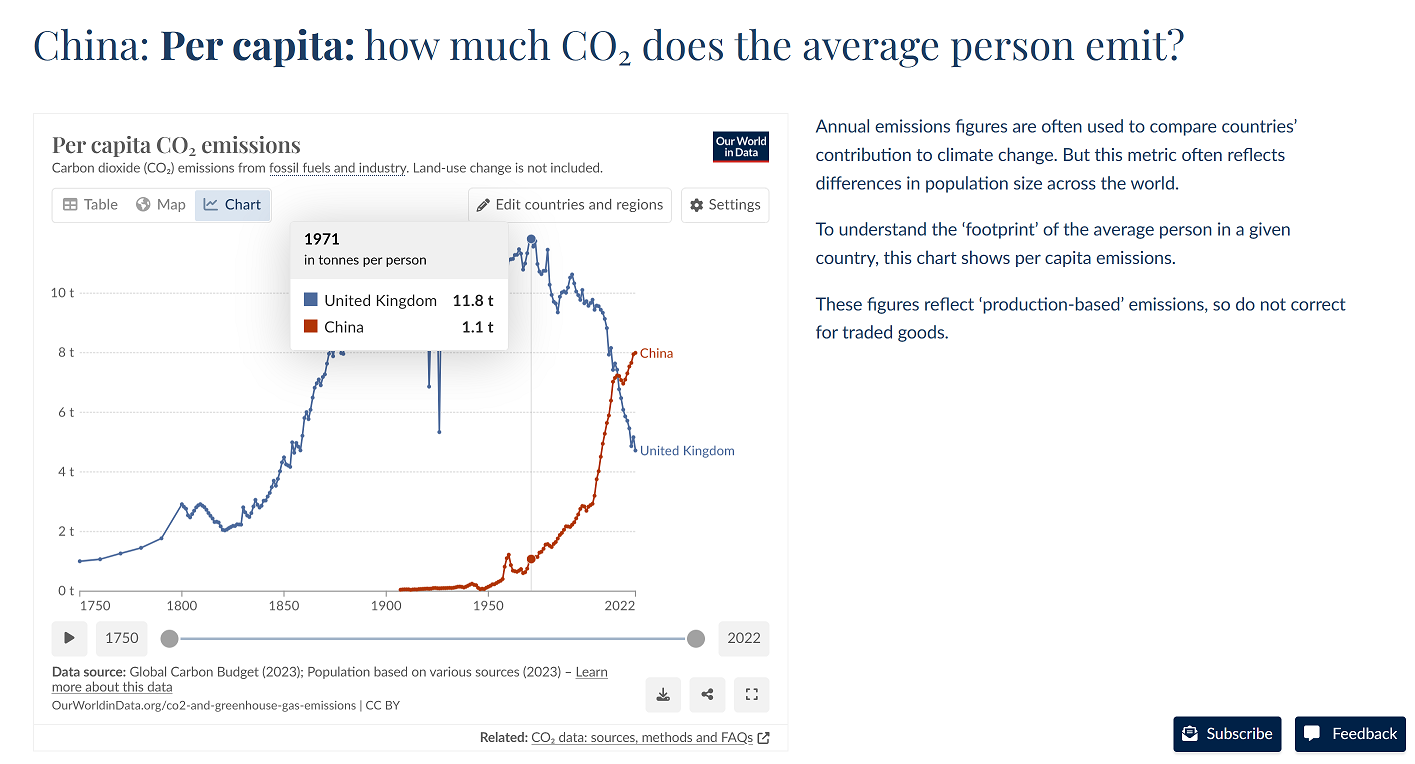
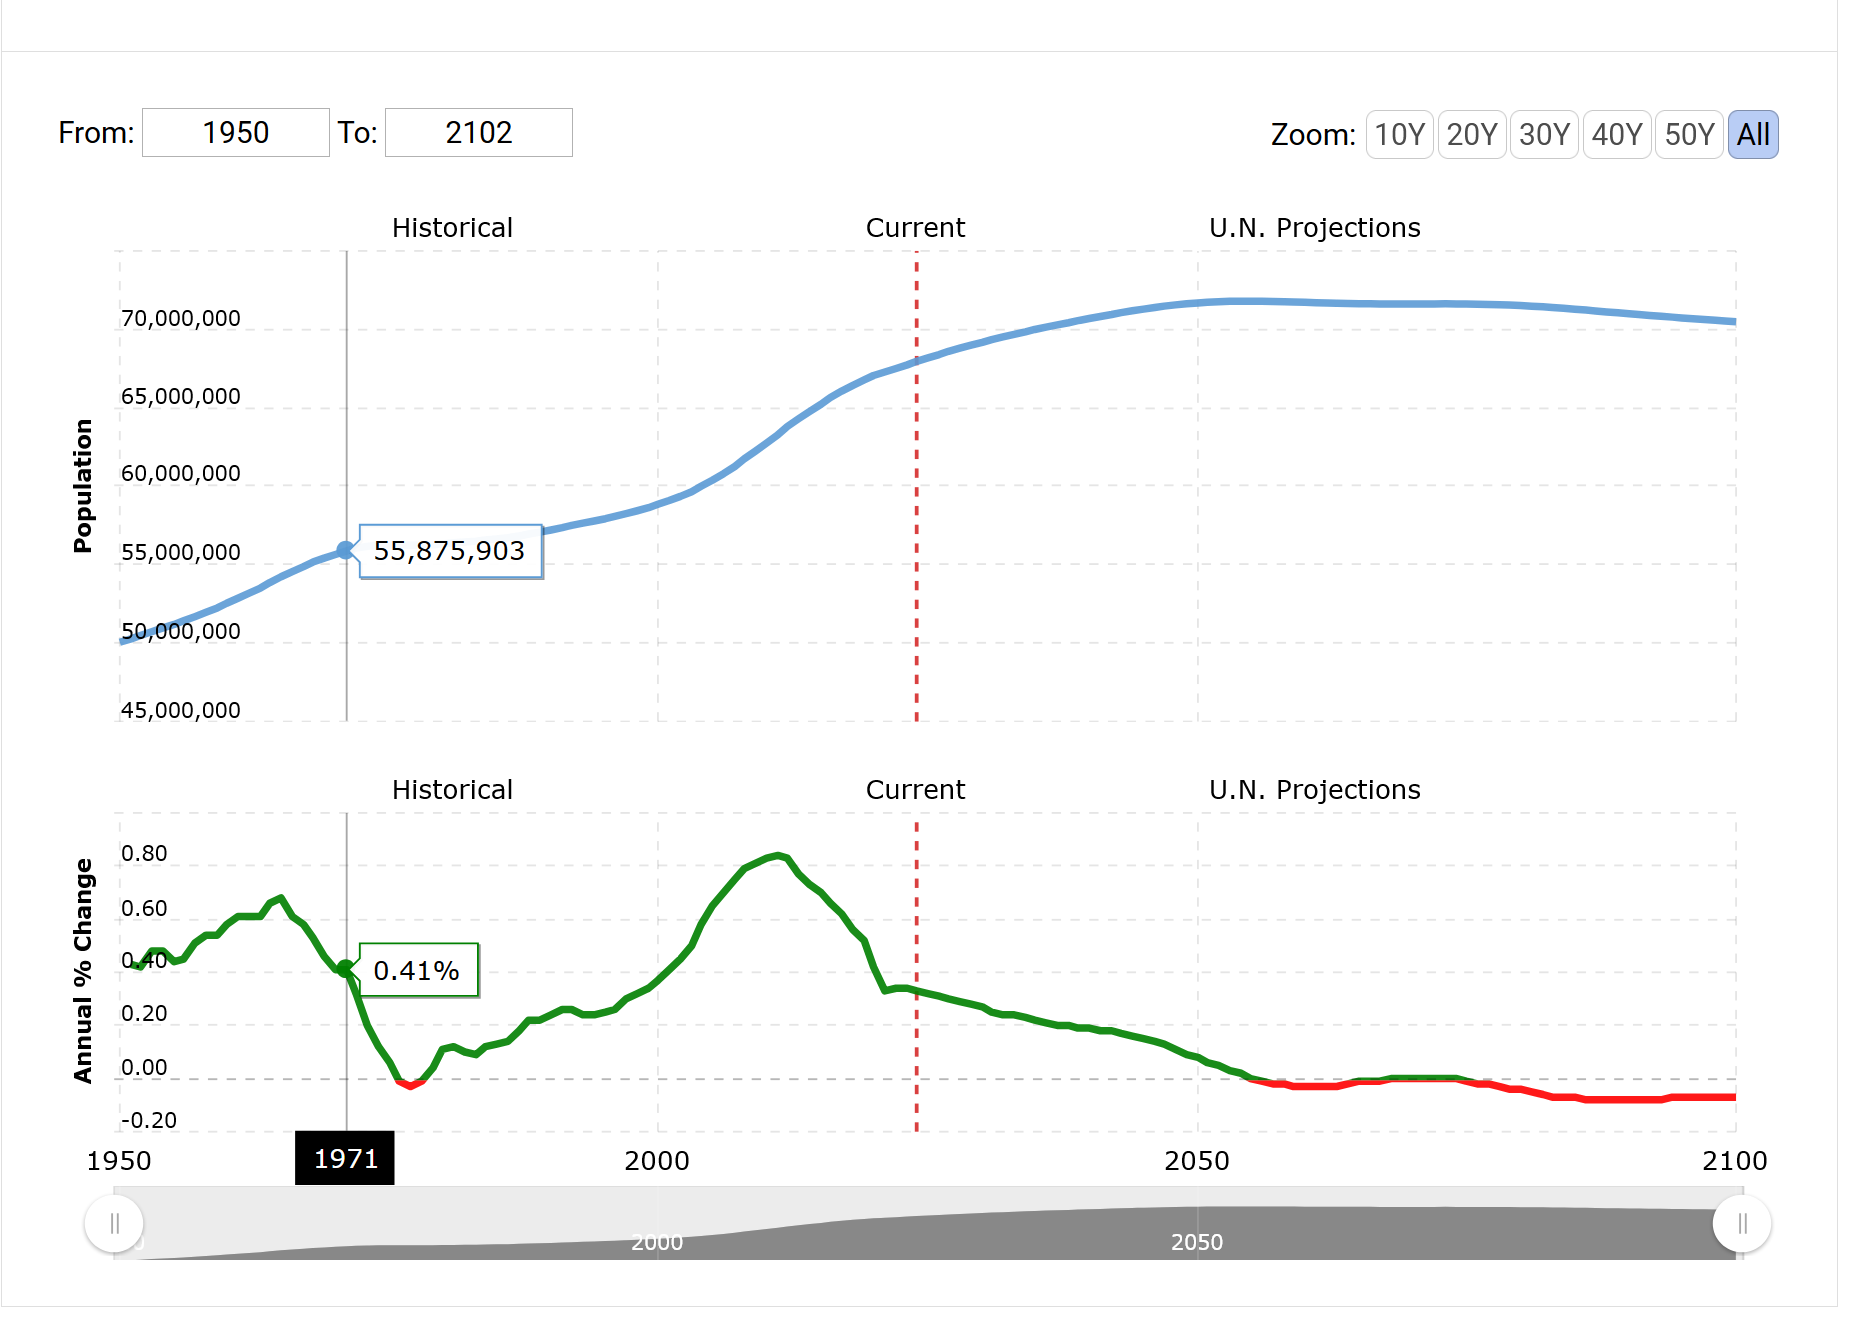
2 pointsHello! Well let's look at that, shall we? The worst case year was 1971, which looked like this. 11.1t per capita UK 1.1t per capita China. The UK population in 1971 was somewhat under 56m. (https://www.macrotrends.net/global-metrics/countries/GBR/united-kingdom/population) That gives the UK's output of CO2 to be 55,875,903 * 11.1 = 620,222,523.3t (a precise rough figure IMO, but I'm running with the available data.) The population of China in 1971 was somewhat over 843m. (https://www.macrotrends.net/global-metrics/countries/CHN/china/population) That gives China's output of CO2 to be 843,285,424 * 1.1 = 976,613,966.4t (another precise rough figure) So even when the UK was at it's worst in terms of CO2 production, China was nearly 1.5 times worse. So how are things today? From the same source, the 2022 (the latest data for CO2 is for 2022, so I've used the same date for population) UK population is now 67,508,936 people, with a CO2 output 4.7t of per capita. Meanwhile the population of China in 2022 was 1,425,887,337 people with a CO2 output of 8.0t per capita. So UK's total CO2 output from the last available data was 67,508,936 * 4.7 = 317,291,999.2t China's total CO2 output from the last available data was 1,425,887,337 * 8.0 = 11,407,098,696.0t China is now nearly 36 times worse than the UK when it comes to CO2 production. I don't care about that, and I don't think you should be trying to muddy the water with that sort of Marxist waffle. What next, CO2 reparations? I think you've inadvertently tipped your hand here. IMO a large part of the "climate change" agenda is far more about so-called 'social justice' and 'wealth redistribution' than it is any actual concern about the planet.

 2 points
 -
Hand washes are what we have around here these days.2 points
-
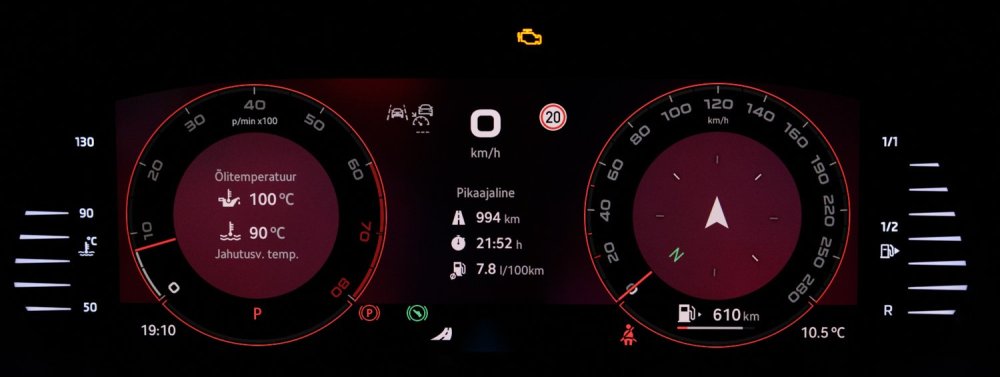
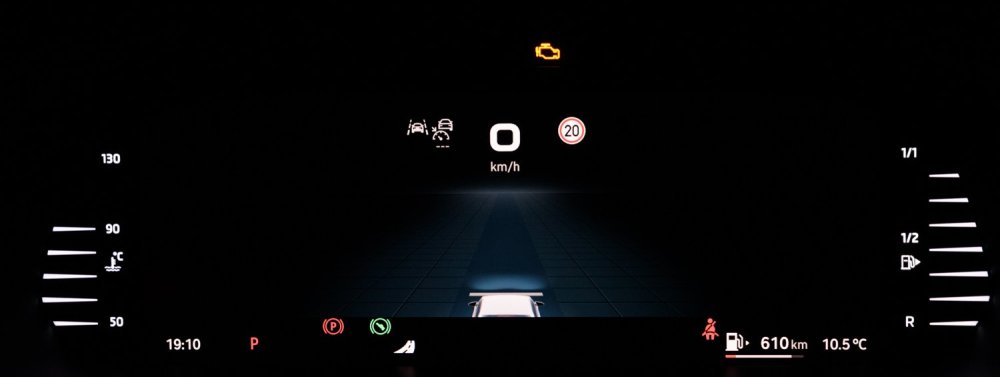
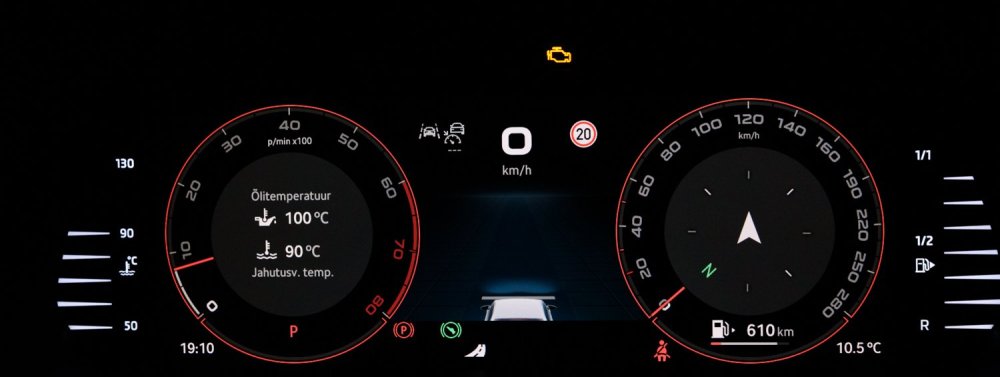
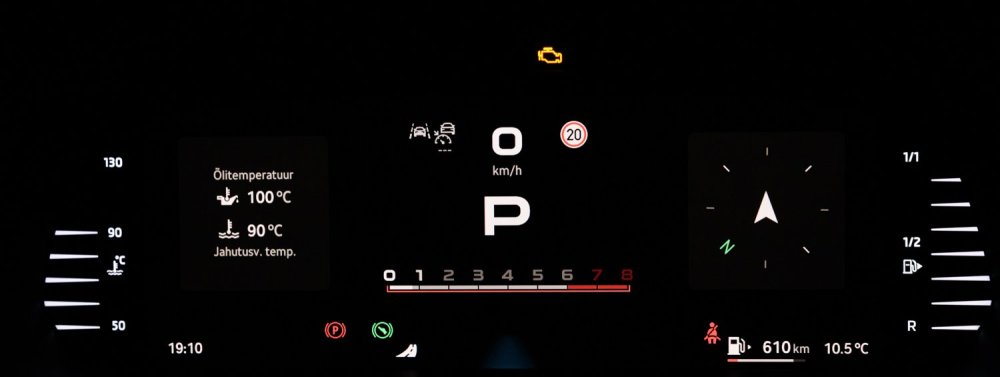
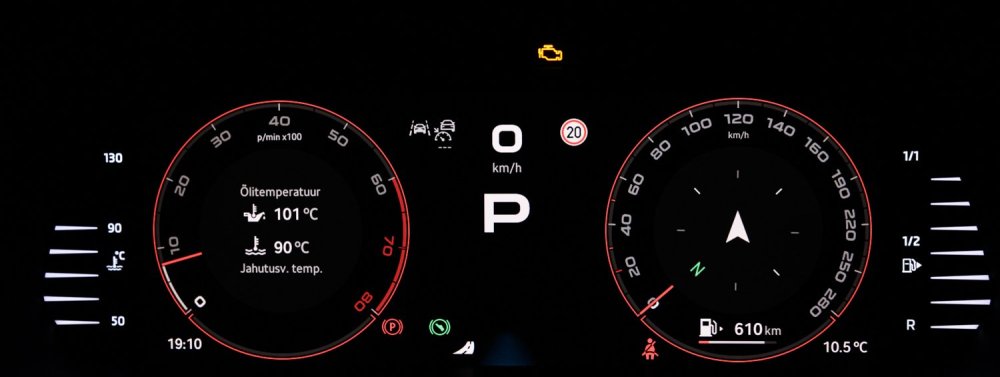
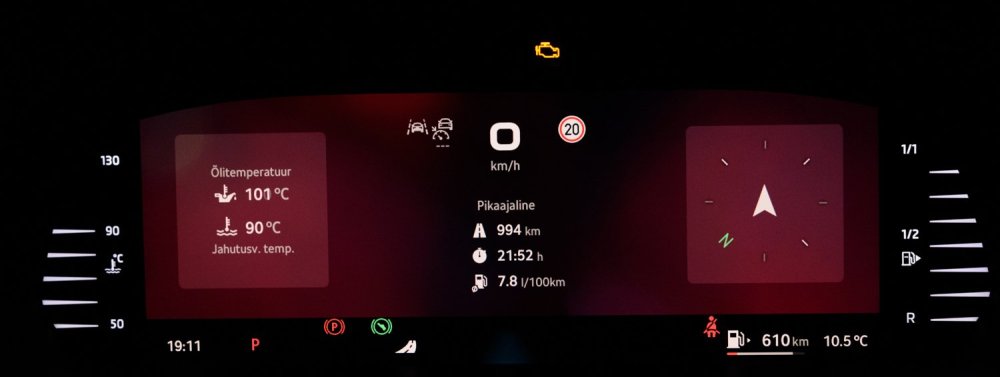
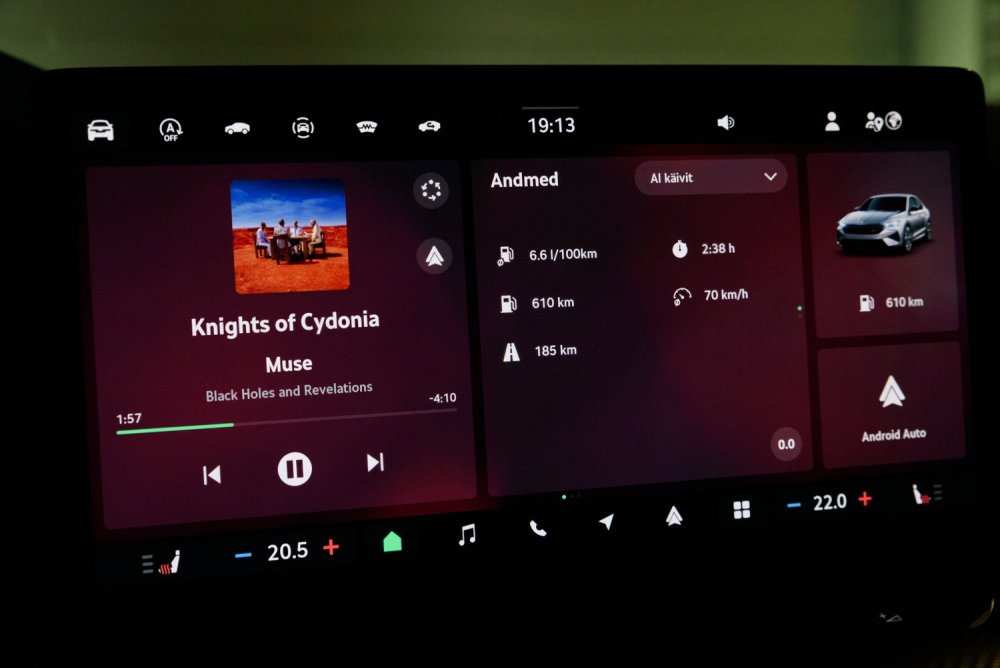
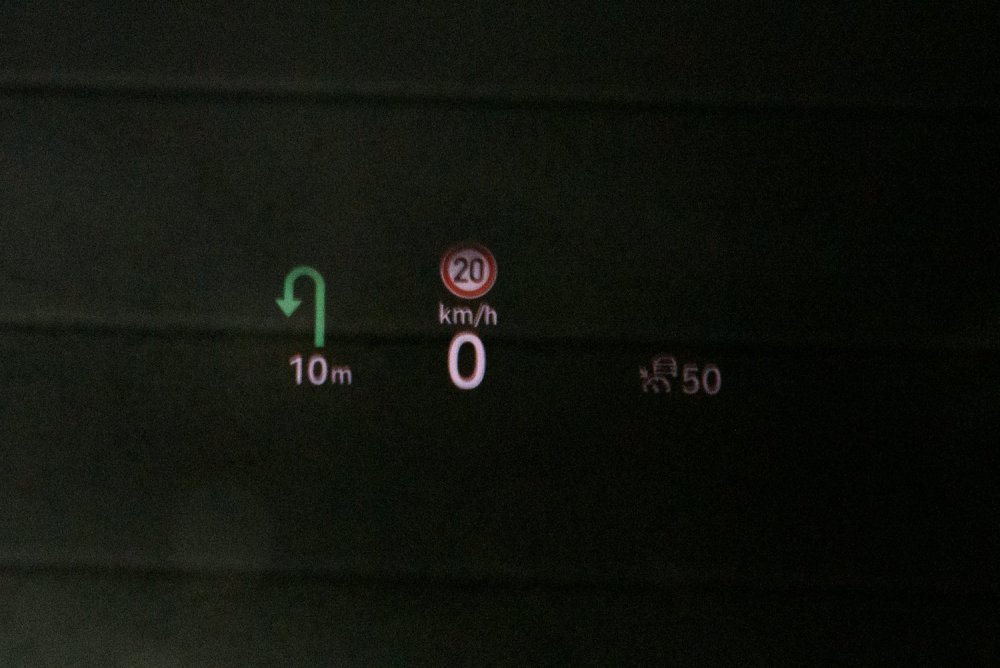
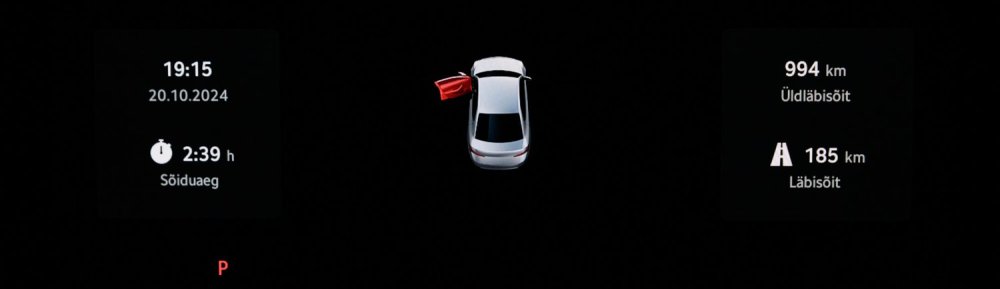
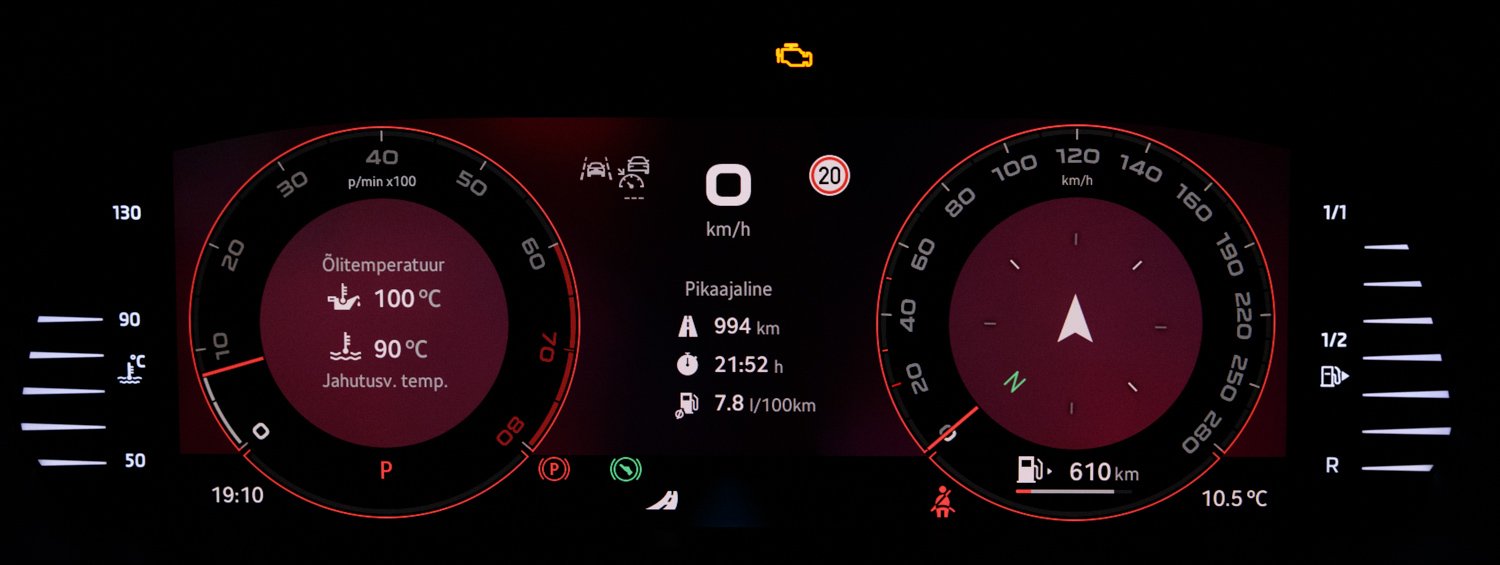
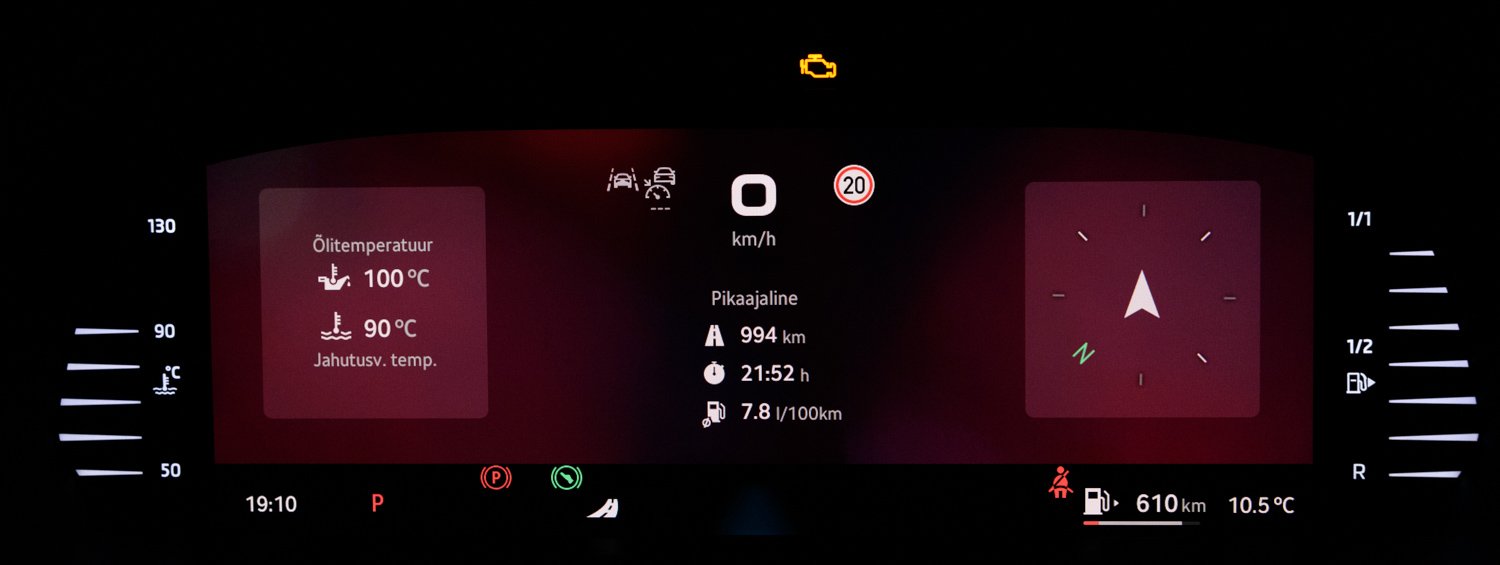
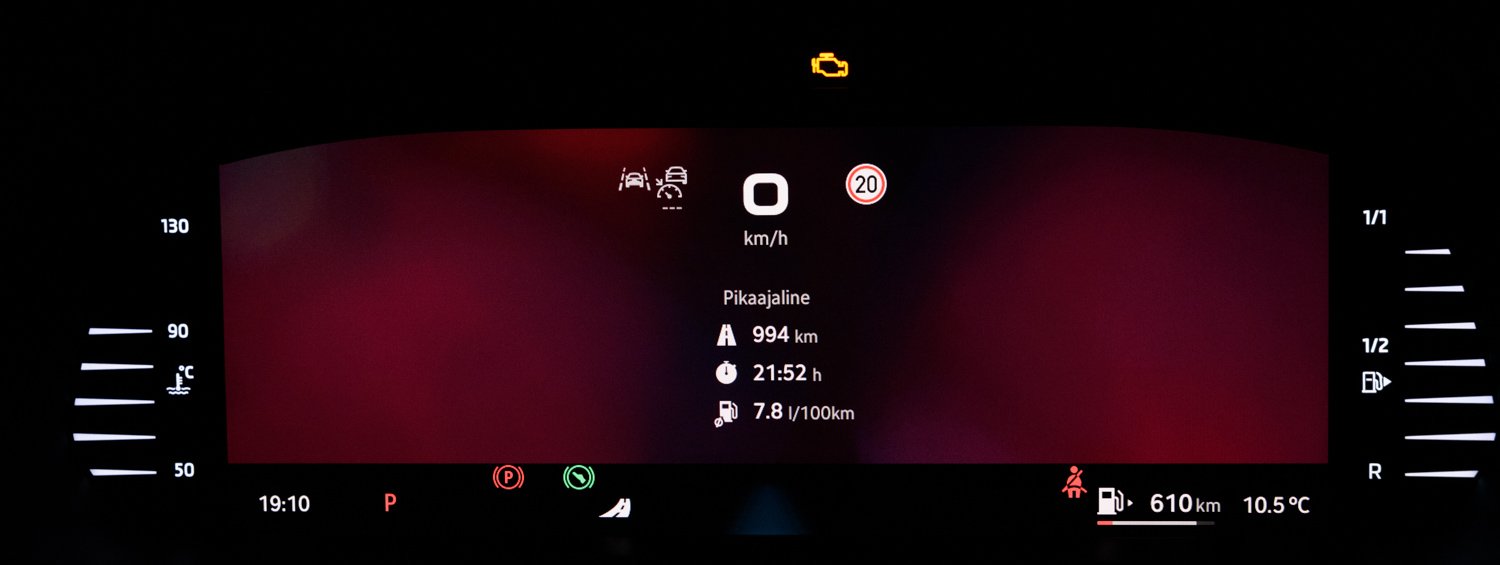
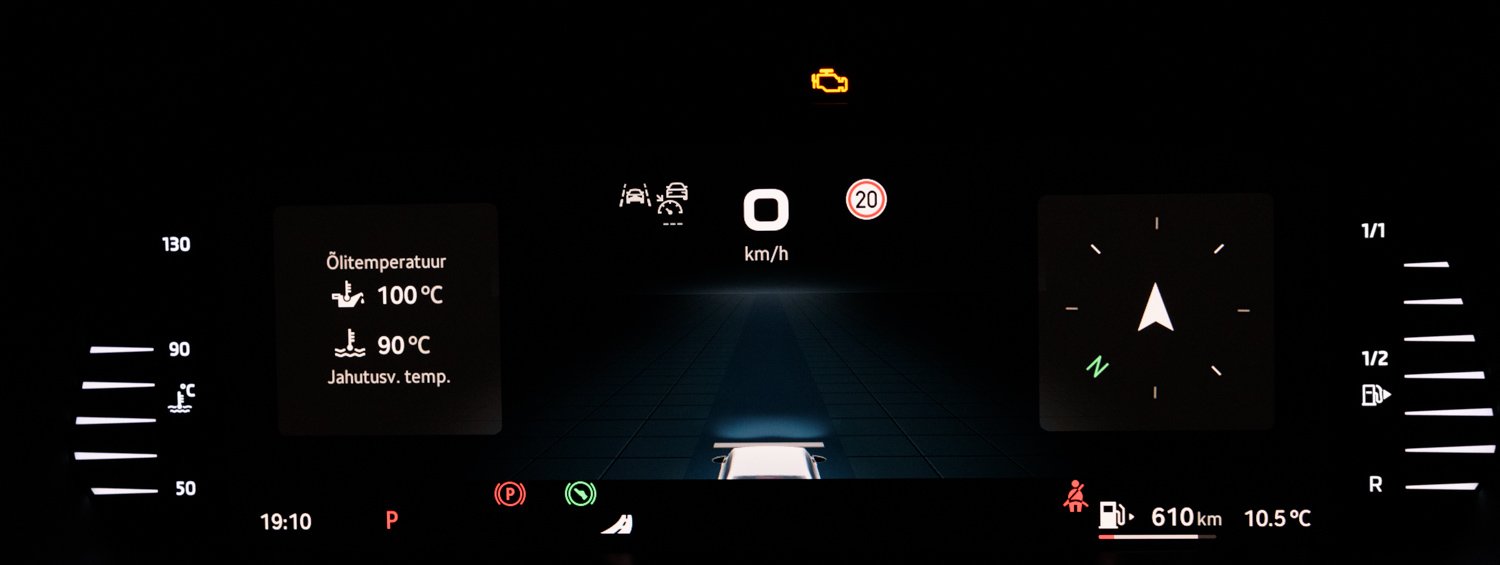
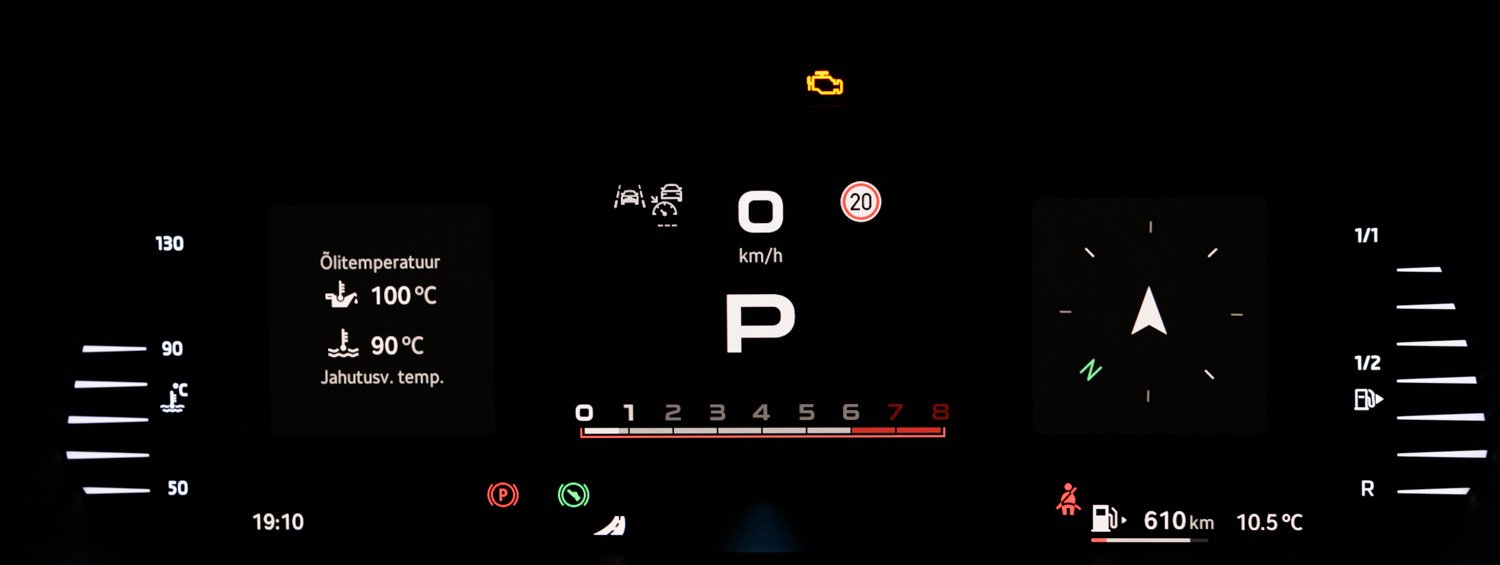
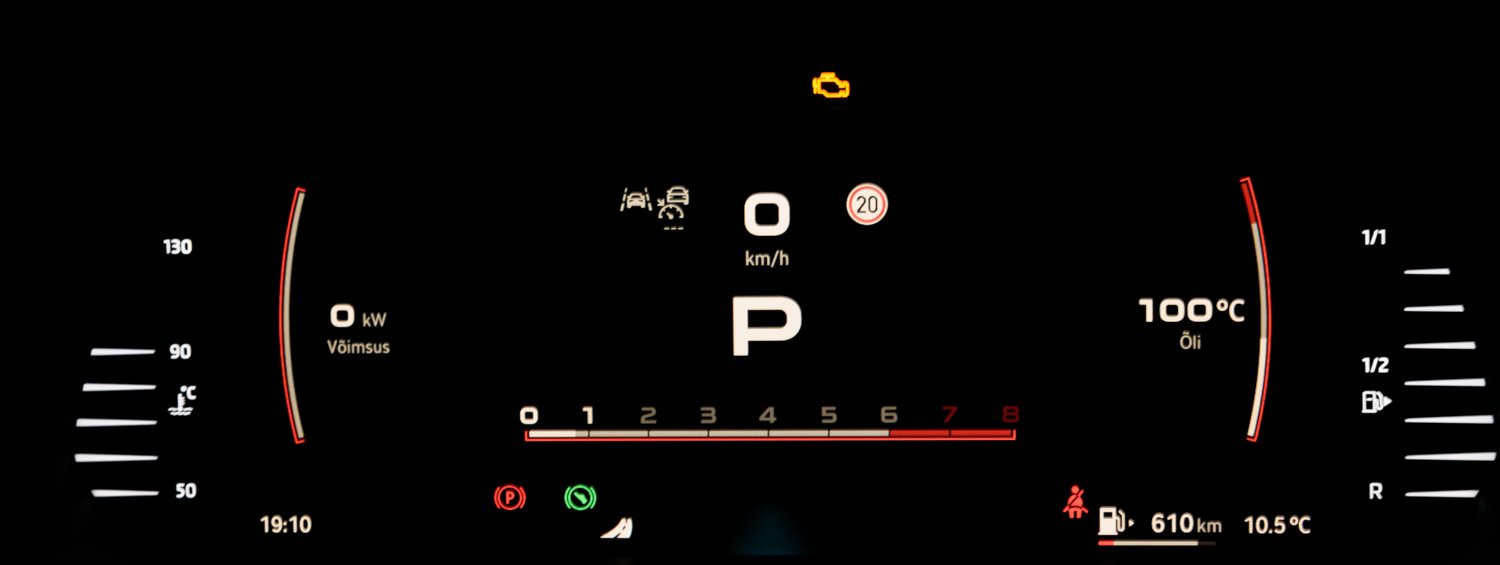
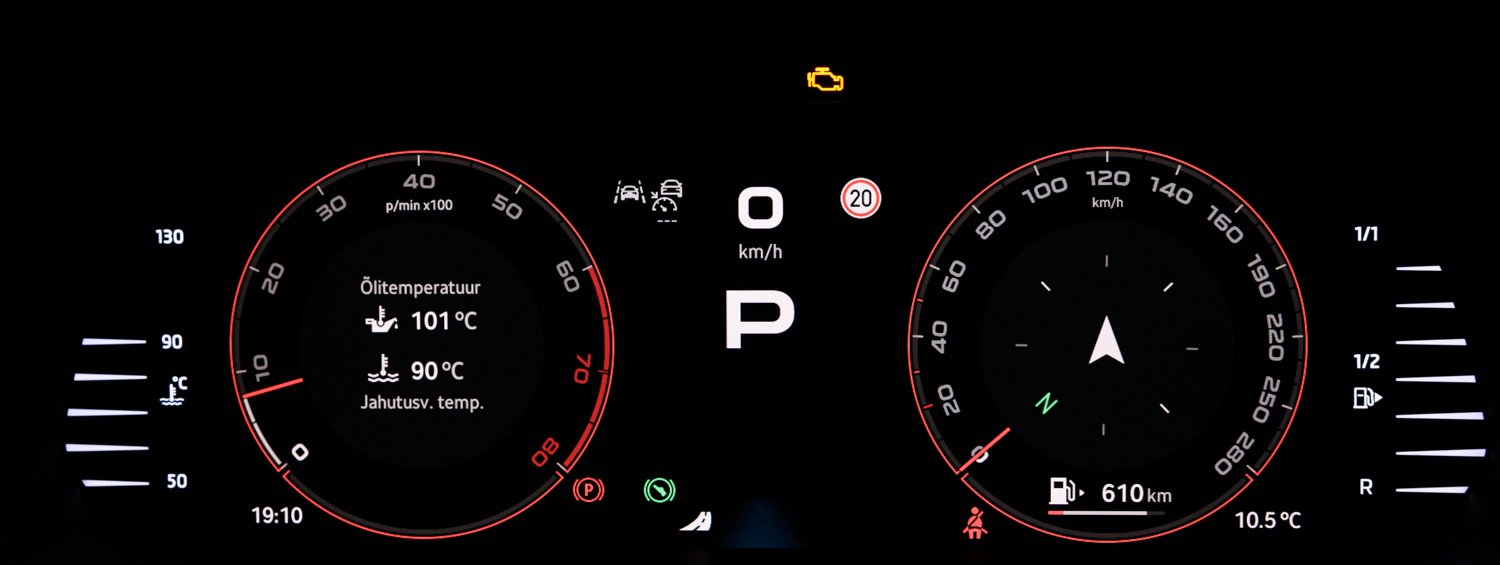
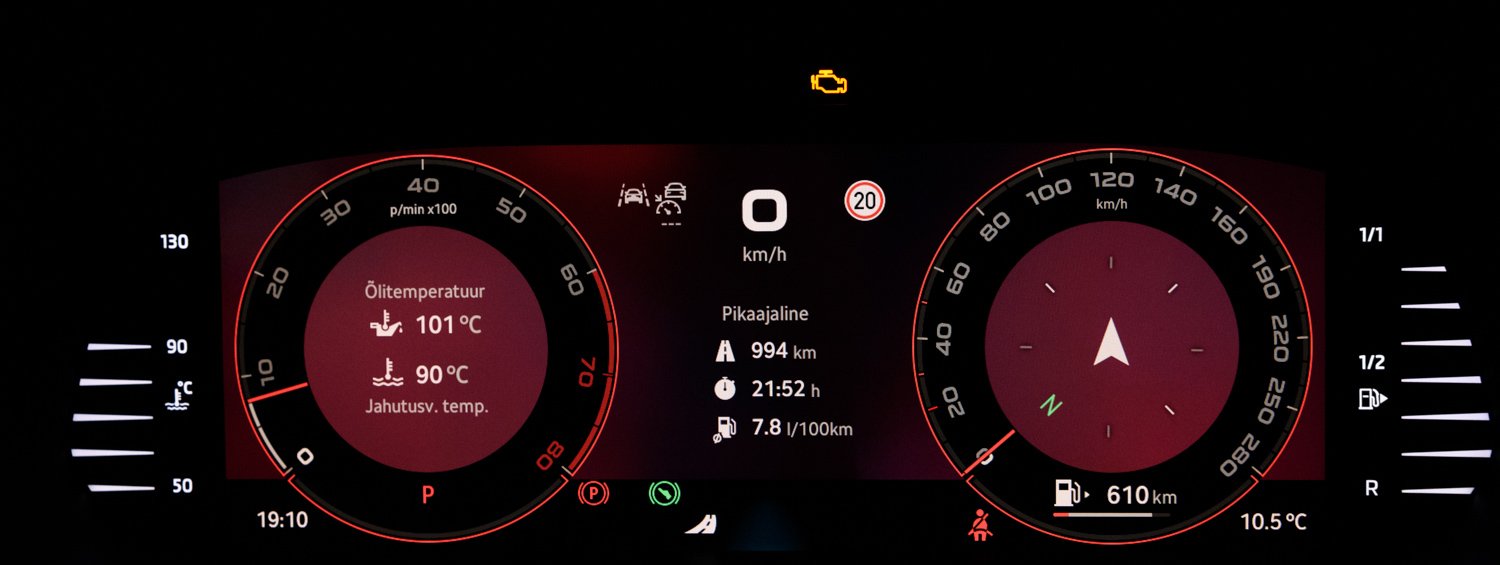
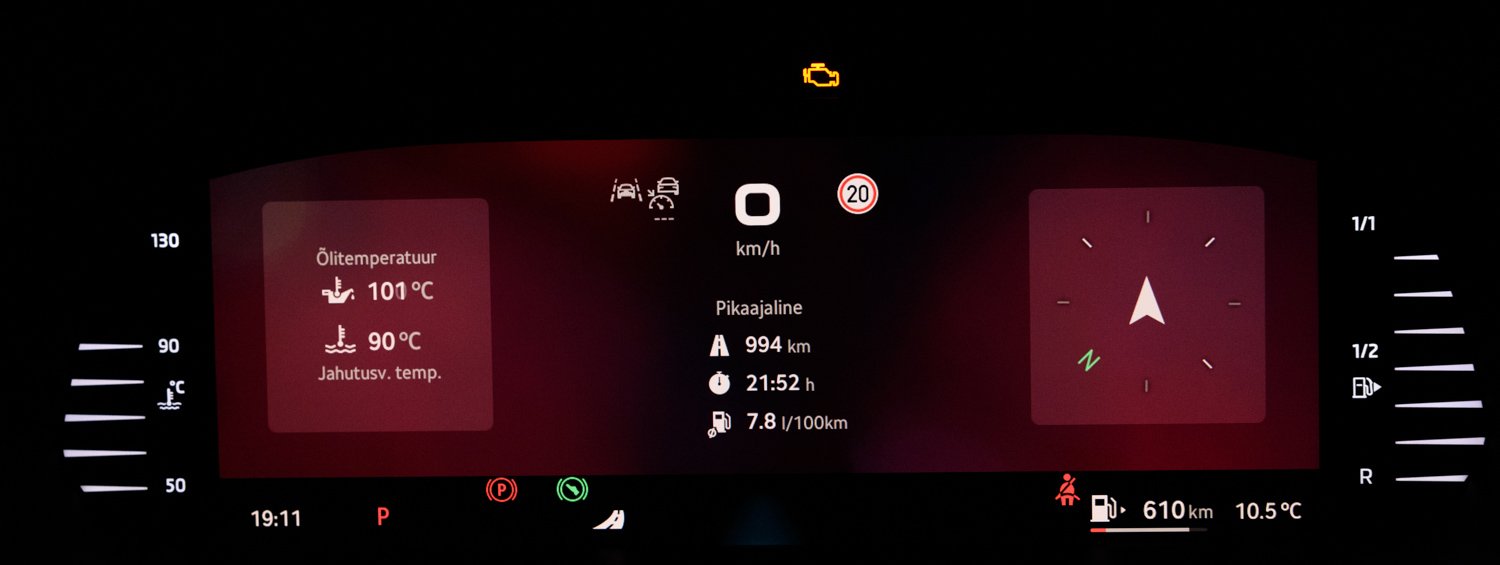
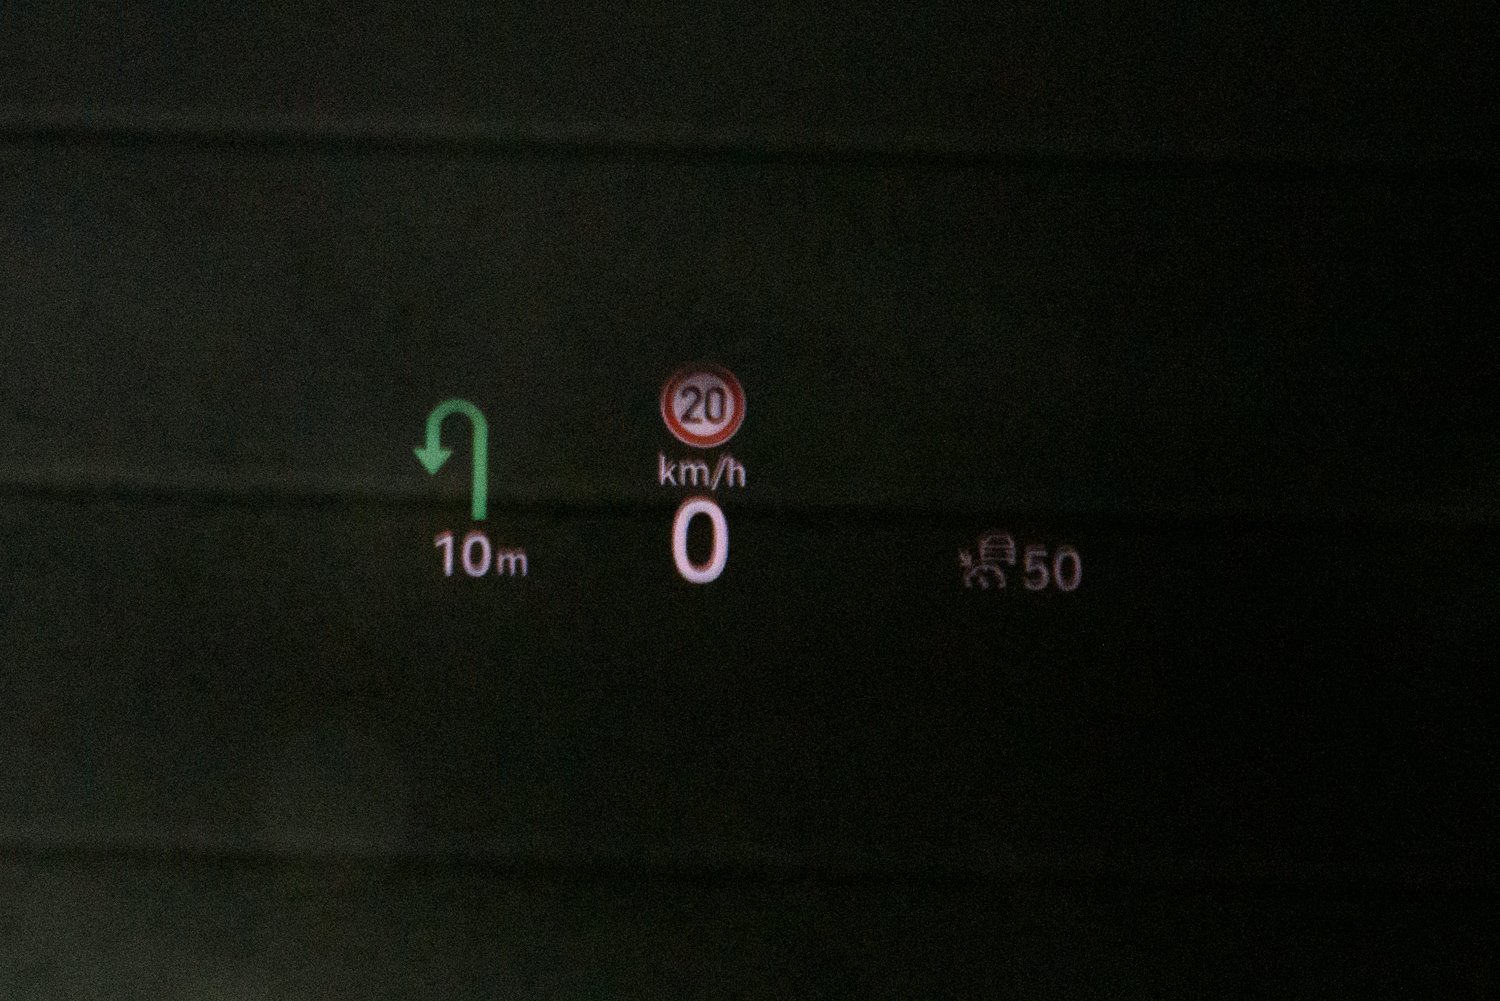
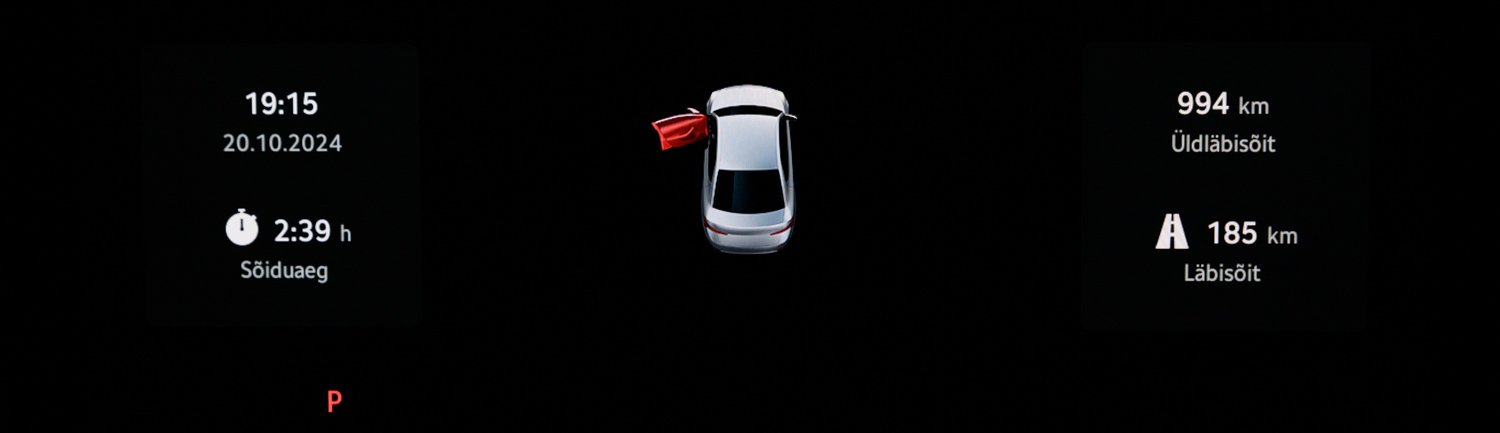
2 pointsHello. So here's a couple of screenshots of the instrument cluster (there's also a screen for the navigation but didn't want to take pictures of that, but it's mostly the same option of layouts). Bonus picture of the infotainment screen (with some useful shortcuts at top and bottom I've set up for myself) and heads up display (with navigation enabled but stationary at the moment of taking the picture). PS! I'm aware I have the "engine" light on. The dealership is still figuring out what to do but it's related to a faulty sensor for exhaust temperature. It's OK to drive and is not causing a limp mode, fortunately.


 2 points
 -
https://www.briskoda.net/forums/topic/481489-turbo-swap-choices-for-ea211-12-tsi/1 point
-
That kind of thing is worth mentioning, or just show your location so that people might know where the work might be getting done. You said quoted 220 for the job. Was that you converting to GBP?1 point
-
Im in balkan. Import rules are strict cars are expensive and the cars in my country with 300k km are considered low mileage. And i really like my skoda i dont wanna trade it1 point
-
1 pointLets forget the car bit, but then this is the EV section, so lets remember that 'Salary Sacrifice' is one thing predicted to change. So talking Gross Income & NI contribution that was near the 1/3 tax to give the net income. Take Home pay. Plenty never smoked, drove, gambled or drank and had not enough to buy insurance for contents etc. These might be the ones that pay for their care in old age because they bought a home, while those that never saved a penny or bought property get everything paid for by others.1 point
-
1 pointGlad you got yours sorted too, probably get them around the same time I guess 😉1 point
-
1 pointSo, the fact that when you put the car into reverse the rear parking sensors alarm constantly is (for most) a ‘problem’. There are other hidden problems too, the incorrect operation of the braking and traction systems, alarm, rear fog light, sat nav etc. The constant on-dash warning lights. As for it being ‘tosh’ that Skoda have released a car with towbar preparation as standard, but with no way to properly code one when fitted, I suspect puts you in the minority. This is one of several clearly unready elements of the MkII that Skoda should have resolved prior to launch, all largely software / programming related. You may love your gold pig, but beyond the small group of owners here on Briskoda, the number of issues being reported elsewhere is growing quickly.1 point
-
1 pointalmost the same as me I ordered around the same time in august, velvet red, rear wiper and canton, mine is build week 46 but only got told build week around 10th october I would guess they got quite a few orders in as they were running that good deposit contribution.. also, seen a few cars now with the aero inserts removed and its 100% confirmed my thoughts that they look loads better without it1 point
-
1 pointThanks guys! sounds promising, will have to take it out for a test drive to make final comparison.1 point
-
This shows how the car was set up at the factory. Although they can change this from QI6 ( Variable ) to QI4 ( fixed ) it won't remember this. When they start a service booking it does ask, when the last service was and what was done, and will then calculate what needs doing now. It gets complicated if there is no history on the system. Sometimes the customer might know / have records. HTH. Thanks AG Falco1 point
-
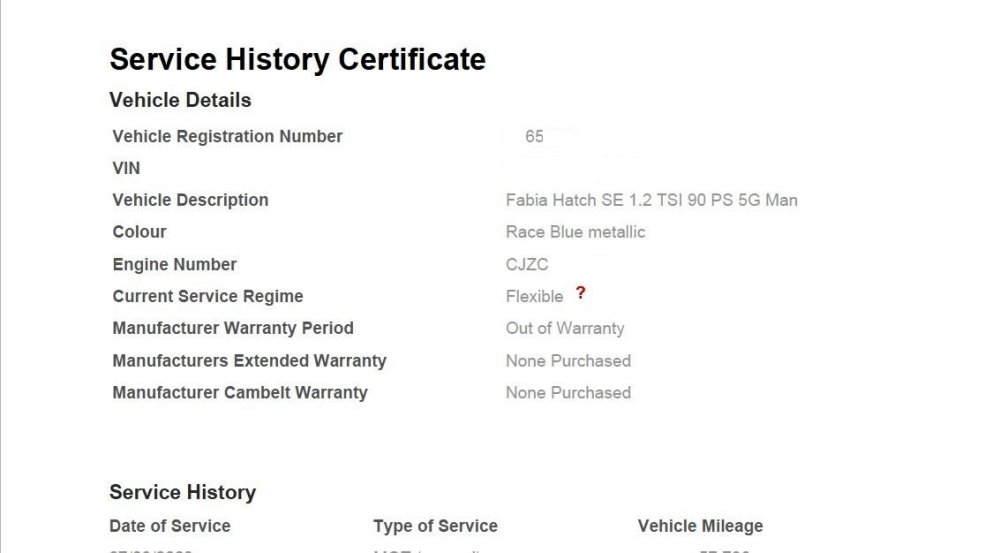
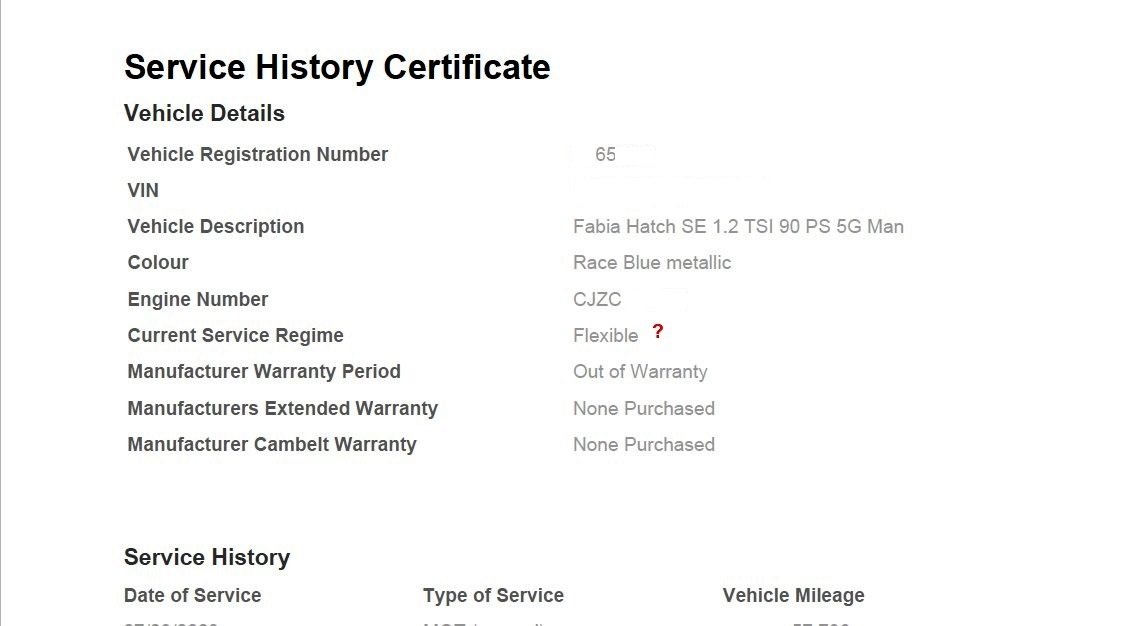
My wife emailed Saturday, got a email back same day and got a phone call and email with PDF of "Service History Certificate" and in the email - "Please find attached the service history for the vehicle as requested. The information is provided by our network of Škoda Retailers and is correct to the best of our knowledge. Please note this information does not include any servicing or repairs that may have been completed independently from our network of authorised Škoda Retailers." which is fair enough. Very fast and good service I have to say. They must have heard of my looks, charm and modesty. 😁 I thought the service had been changed from Flexible to Fixed once out of manufacturer's warranty and the car's had the engine oil & filter "service" change every 12 months in our ownership (and if I can be arsed I might change the oil & filter twice a year now as I done the last (annual) engine oil & filter change on the car.
 1 point
 -
1 pointOf course, there is tax on tax, maybe more if we let them get away with it. You pay tax when you earn it, pay tax when you spend it and pay tax again when you save it.1 point
-
1 pointOne thing to remember, all of the vehicle control modules will be in awake mode, so current drain on battery will be considerably more than just the tv tuner.1 point
-
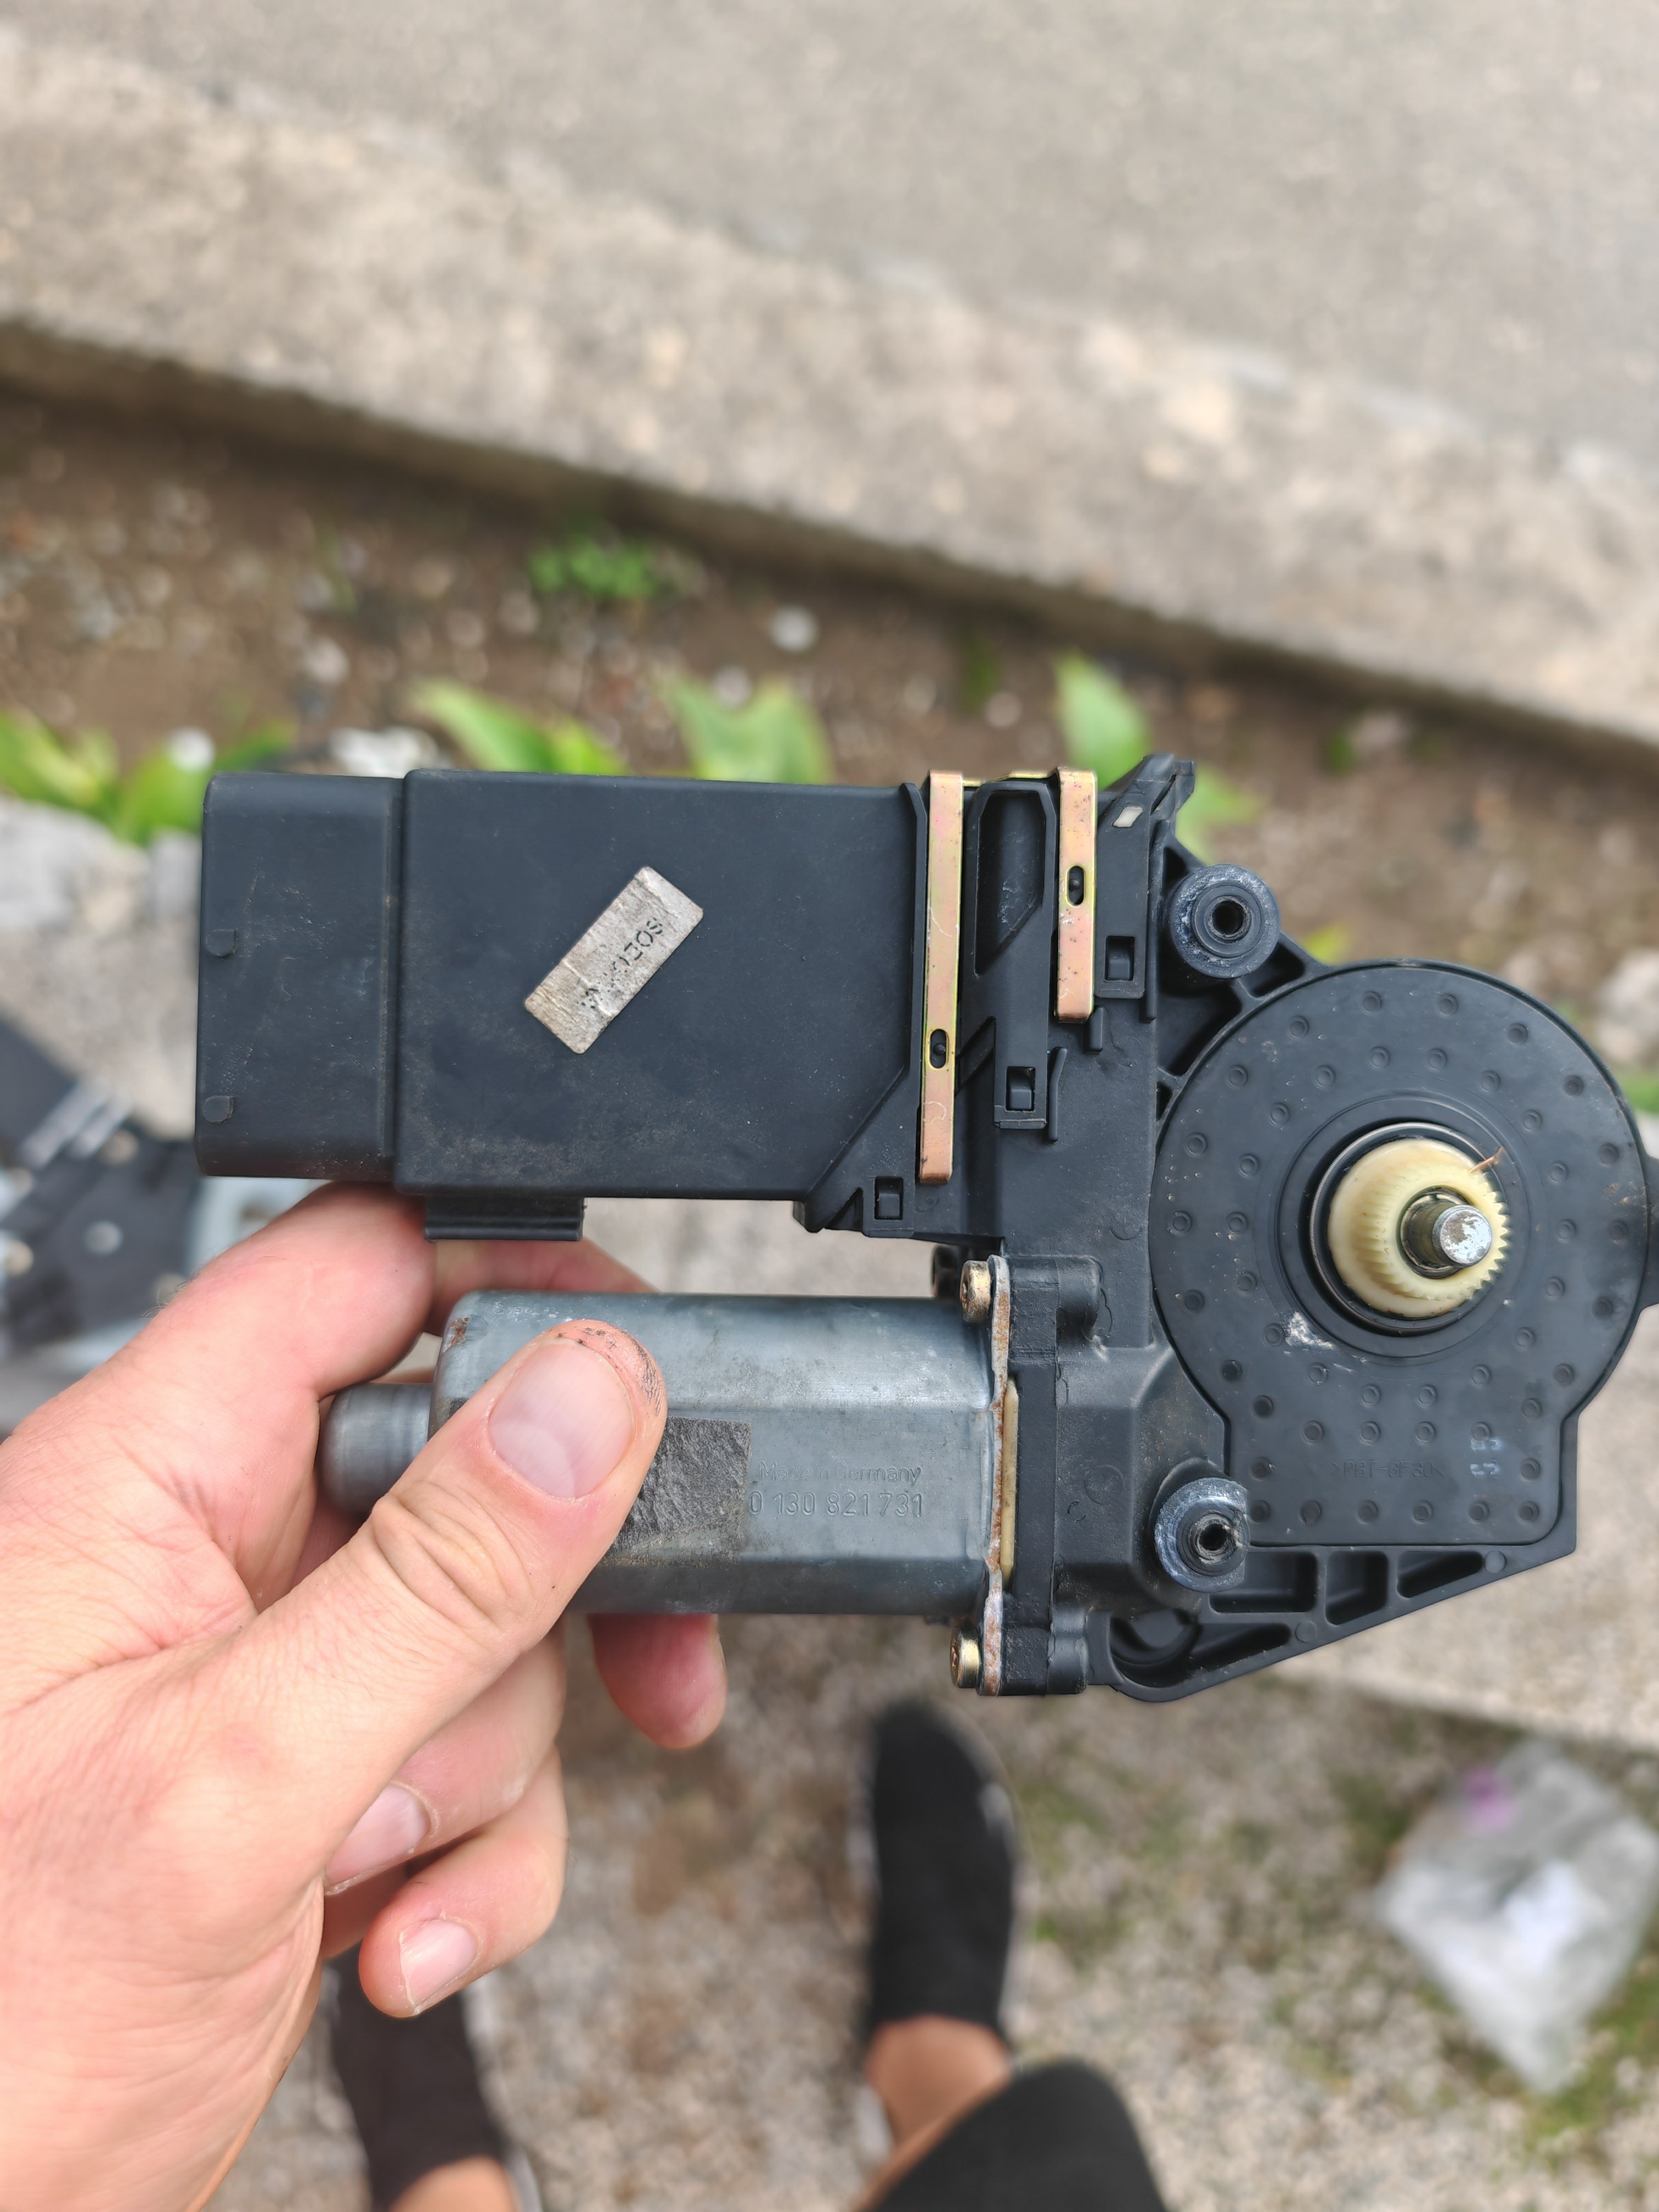
1 pointaaaah the old control unit i taped it up after installing a replacement and the used a spray of ignition sealer to add to the protection1 point
-
I washed all the glass and reg plates before the MOT but as for the rest, it's harder to see the dent when it's dirty...1 point
-
1 pointI had a TV tuner on my mk II that I often used when SWMBO went shopping. It'd run for a while with the engine turned off, them it'd warn you that the battery needed charging, so I'd start the engine for a few minutes and turn the engine off again and continue to watch it either until SWMBO returned or the warning reappeared. It's over 7 years since I had this car, so I can't remember how much time the TV would run for before the battery was depleted.1 point
-
The price & quality of our local car washes are not great so I don't use them anymore. Instead I bought a DI mains water filter which I attach to my pressure washer & snow foam gun. A quick blast with the snow foam, leave for a few minutes & then rinse with clean water from the pressure washer & leave it to dry naturally. It gets most of the winter grime off. For better results I do need to do a contact wash with mitts & shampoo but during winter this rarely gets done. Seriously thinking about getting some paint correction & ceramic coating done at some point to make cleaning easier.1 point
-
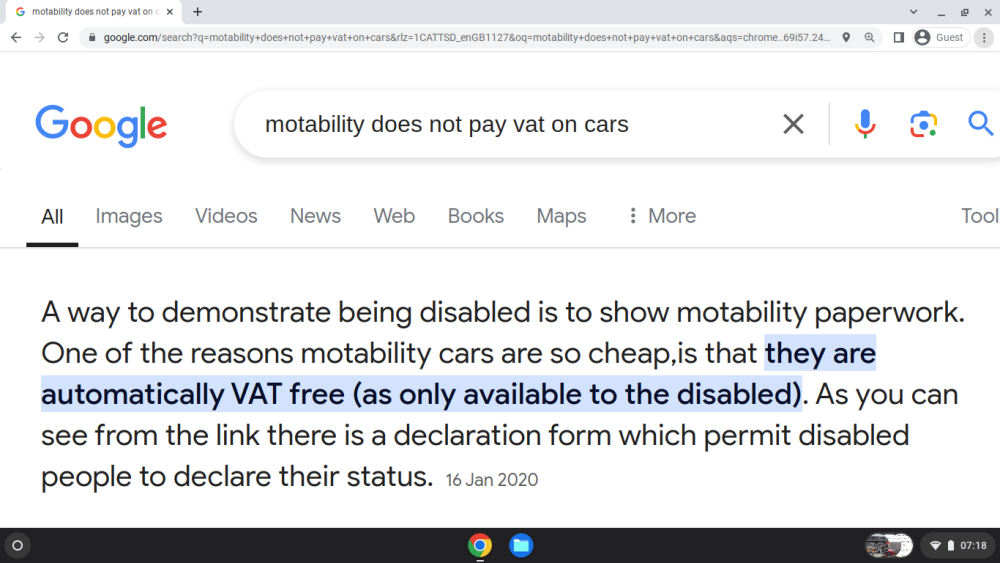
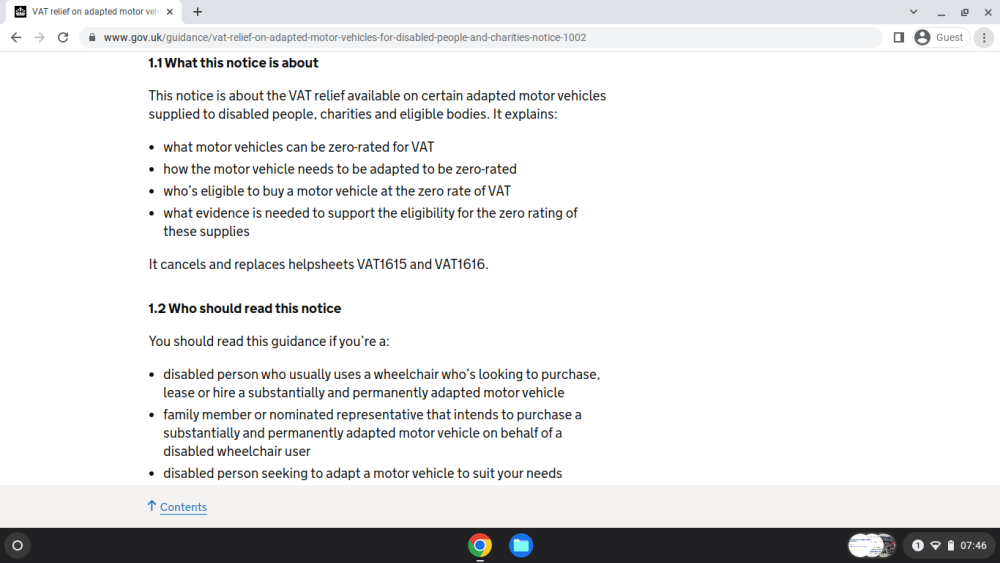
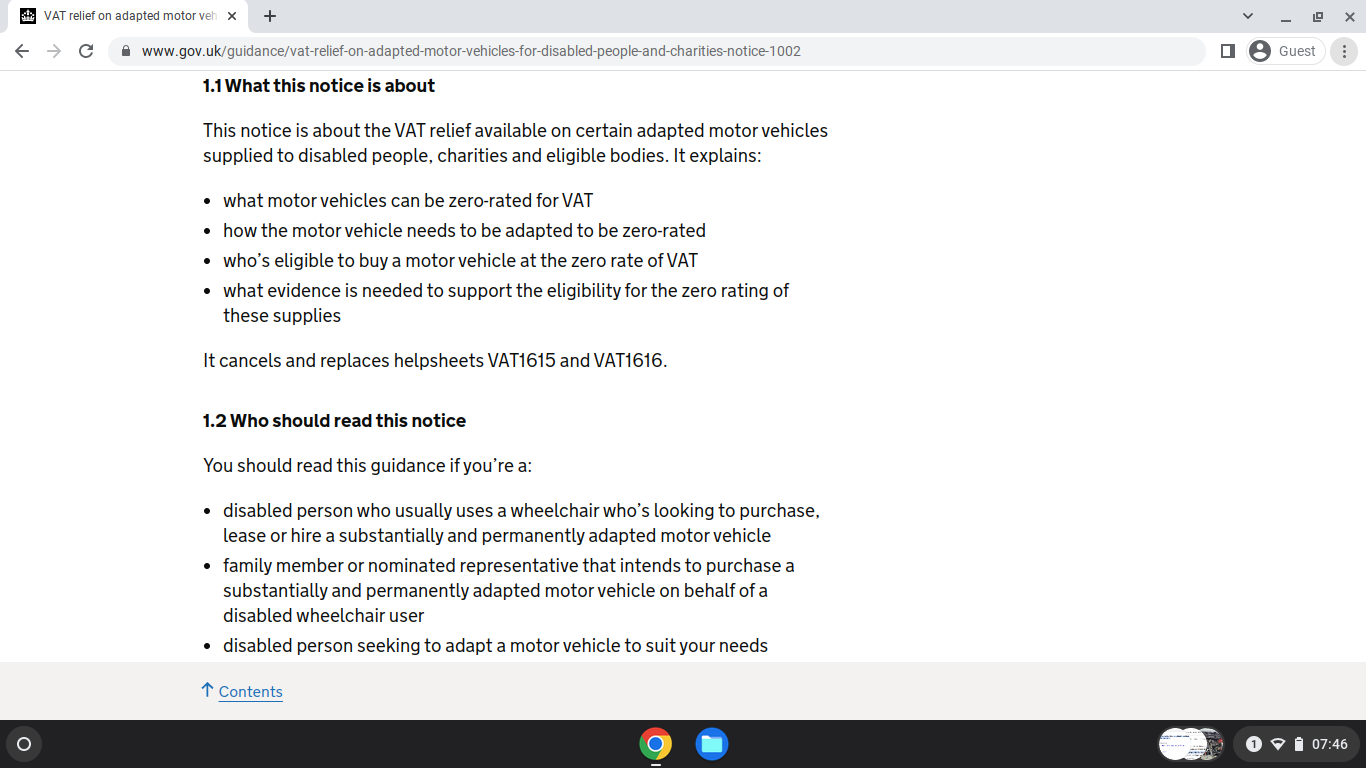
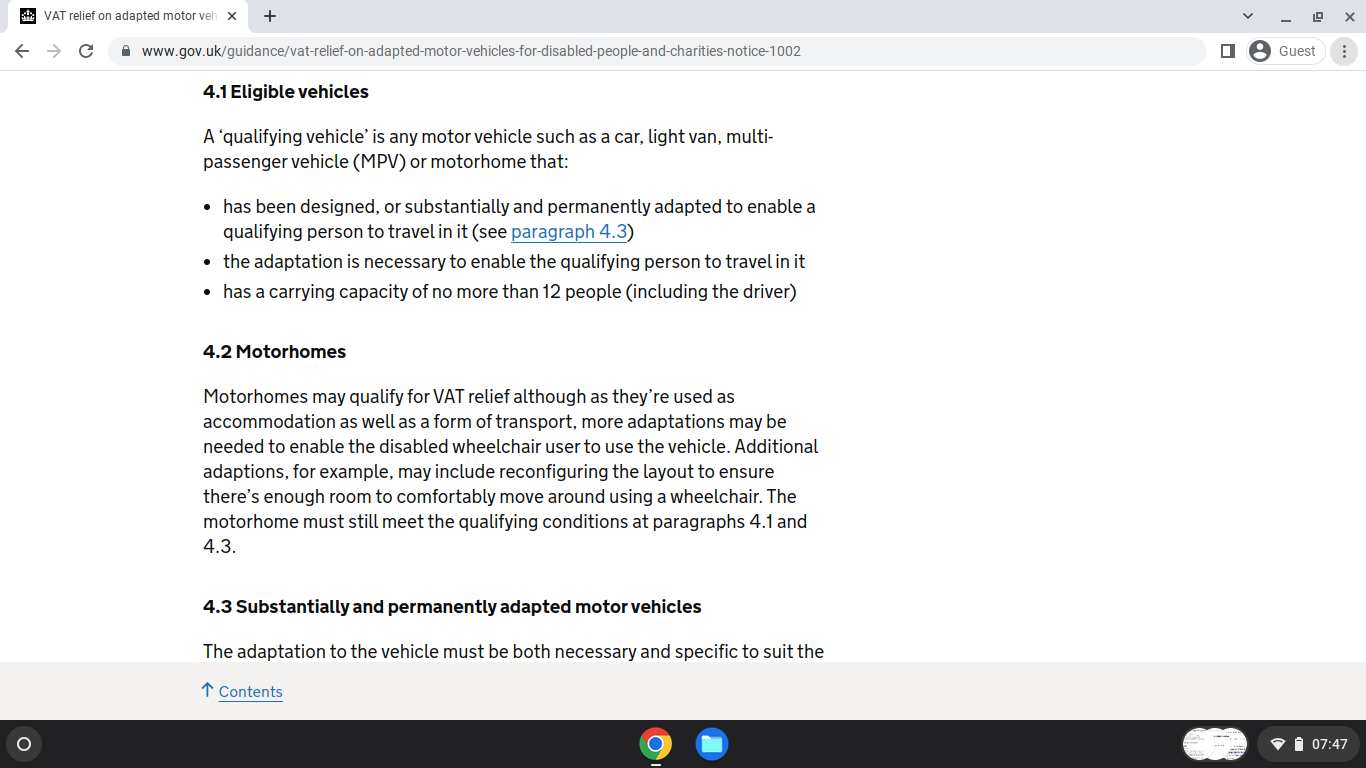
1 point@moley Every car buyer does not pay VAT on cars. MOTABILITY Finance do not pay VAT on the vehicles they buy outright from the manufacturers / importers. Then the person leasing the vehicle is exempt from VED. They no longer need an exemption certificate as it is covered by a group cover. Disable drivers or Registered Keepers of a privately owned or lease vehicle can be exempt from VED. Vehicle class disabled. Conversions & Modifications of vehicles for disabled users is VAT exempt. There are certain Emergency Vehicles & for Charities that are Zero VAT Rated or VAT Exempt. That does not include Police Vehicles in Scotland, and their are Mountain Rescue vehicles not Zero VAT Rated.

 1 point
 -
1 point
-
1 pointAll car buyers pay thousands in VAT regardless of motive source, another distraction/deflection attempt. It's not an EV specific thing. EVs have benefitted from favourable VED rates because of the Government's interventions in the market, it's time for those favourable rates to be scrapped1 point
-
1 pointDo you mean to say that skoda actually learned a hard lesson from the previous infotainment system debacle?1 point
-
1 pointI guess there would be a wire going into bottom of the fuel filter housing if there is a sensor.1 point
-
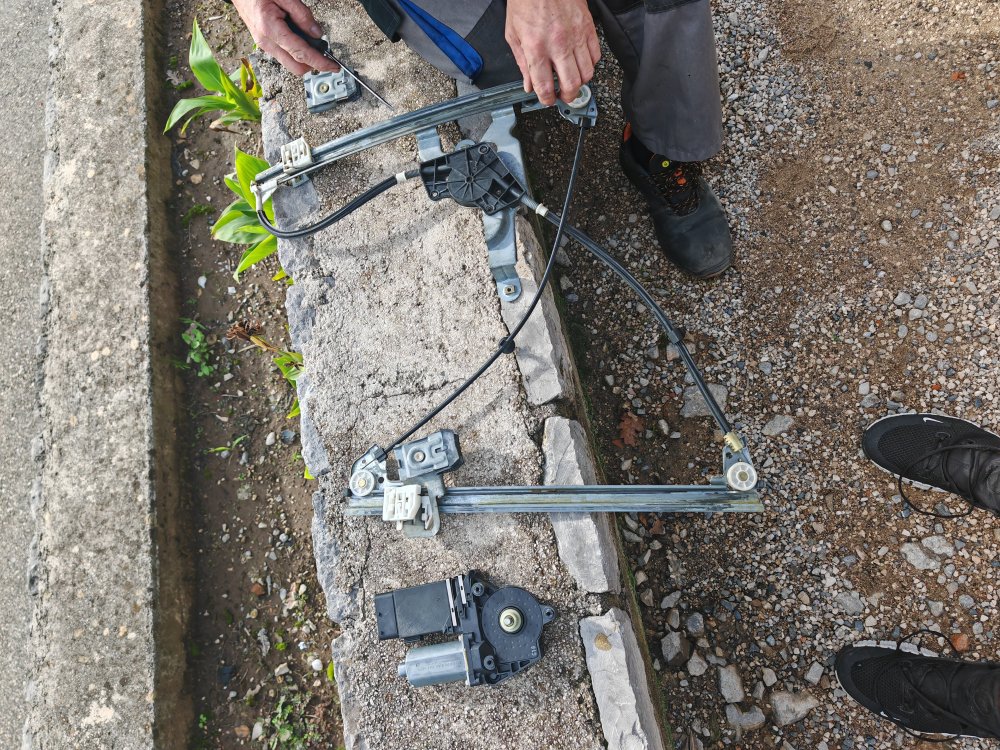
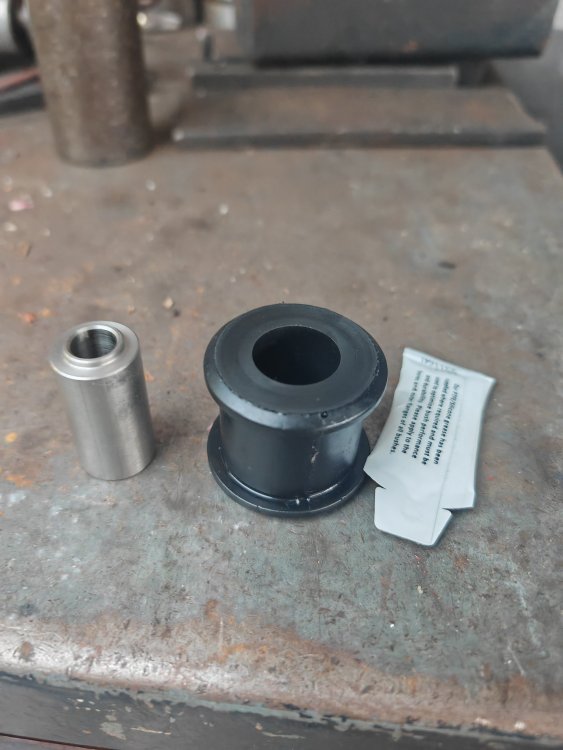
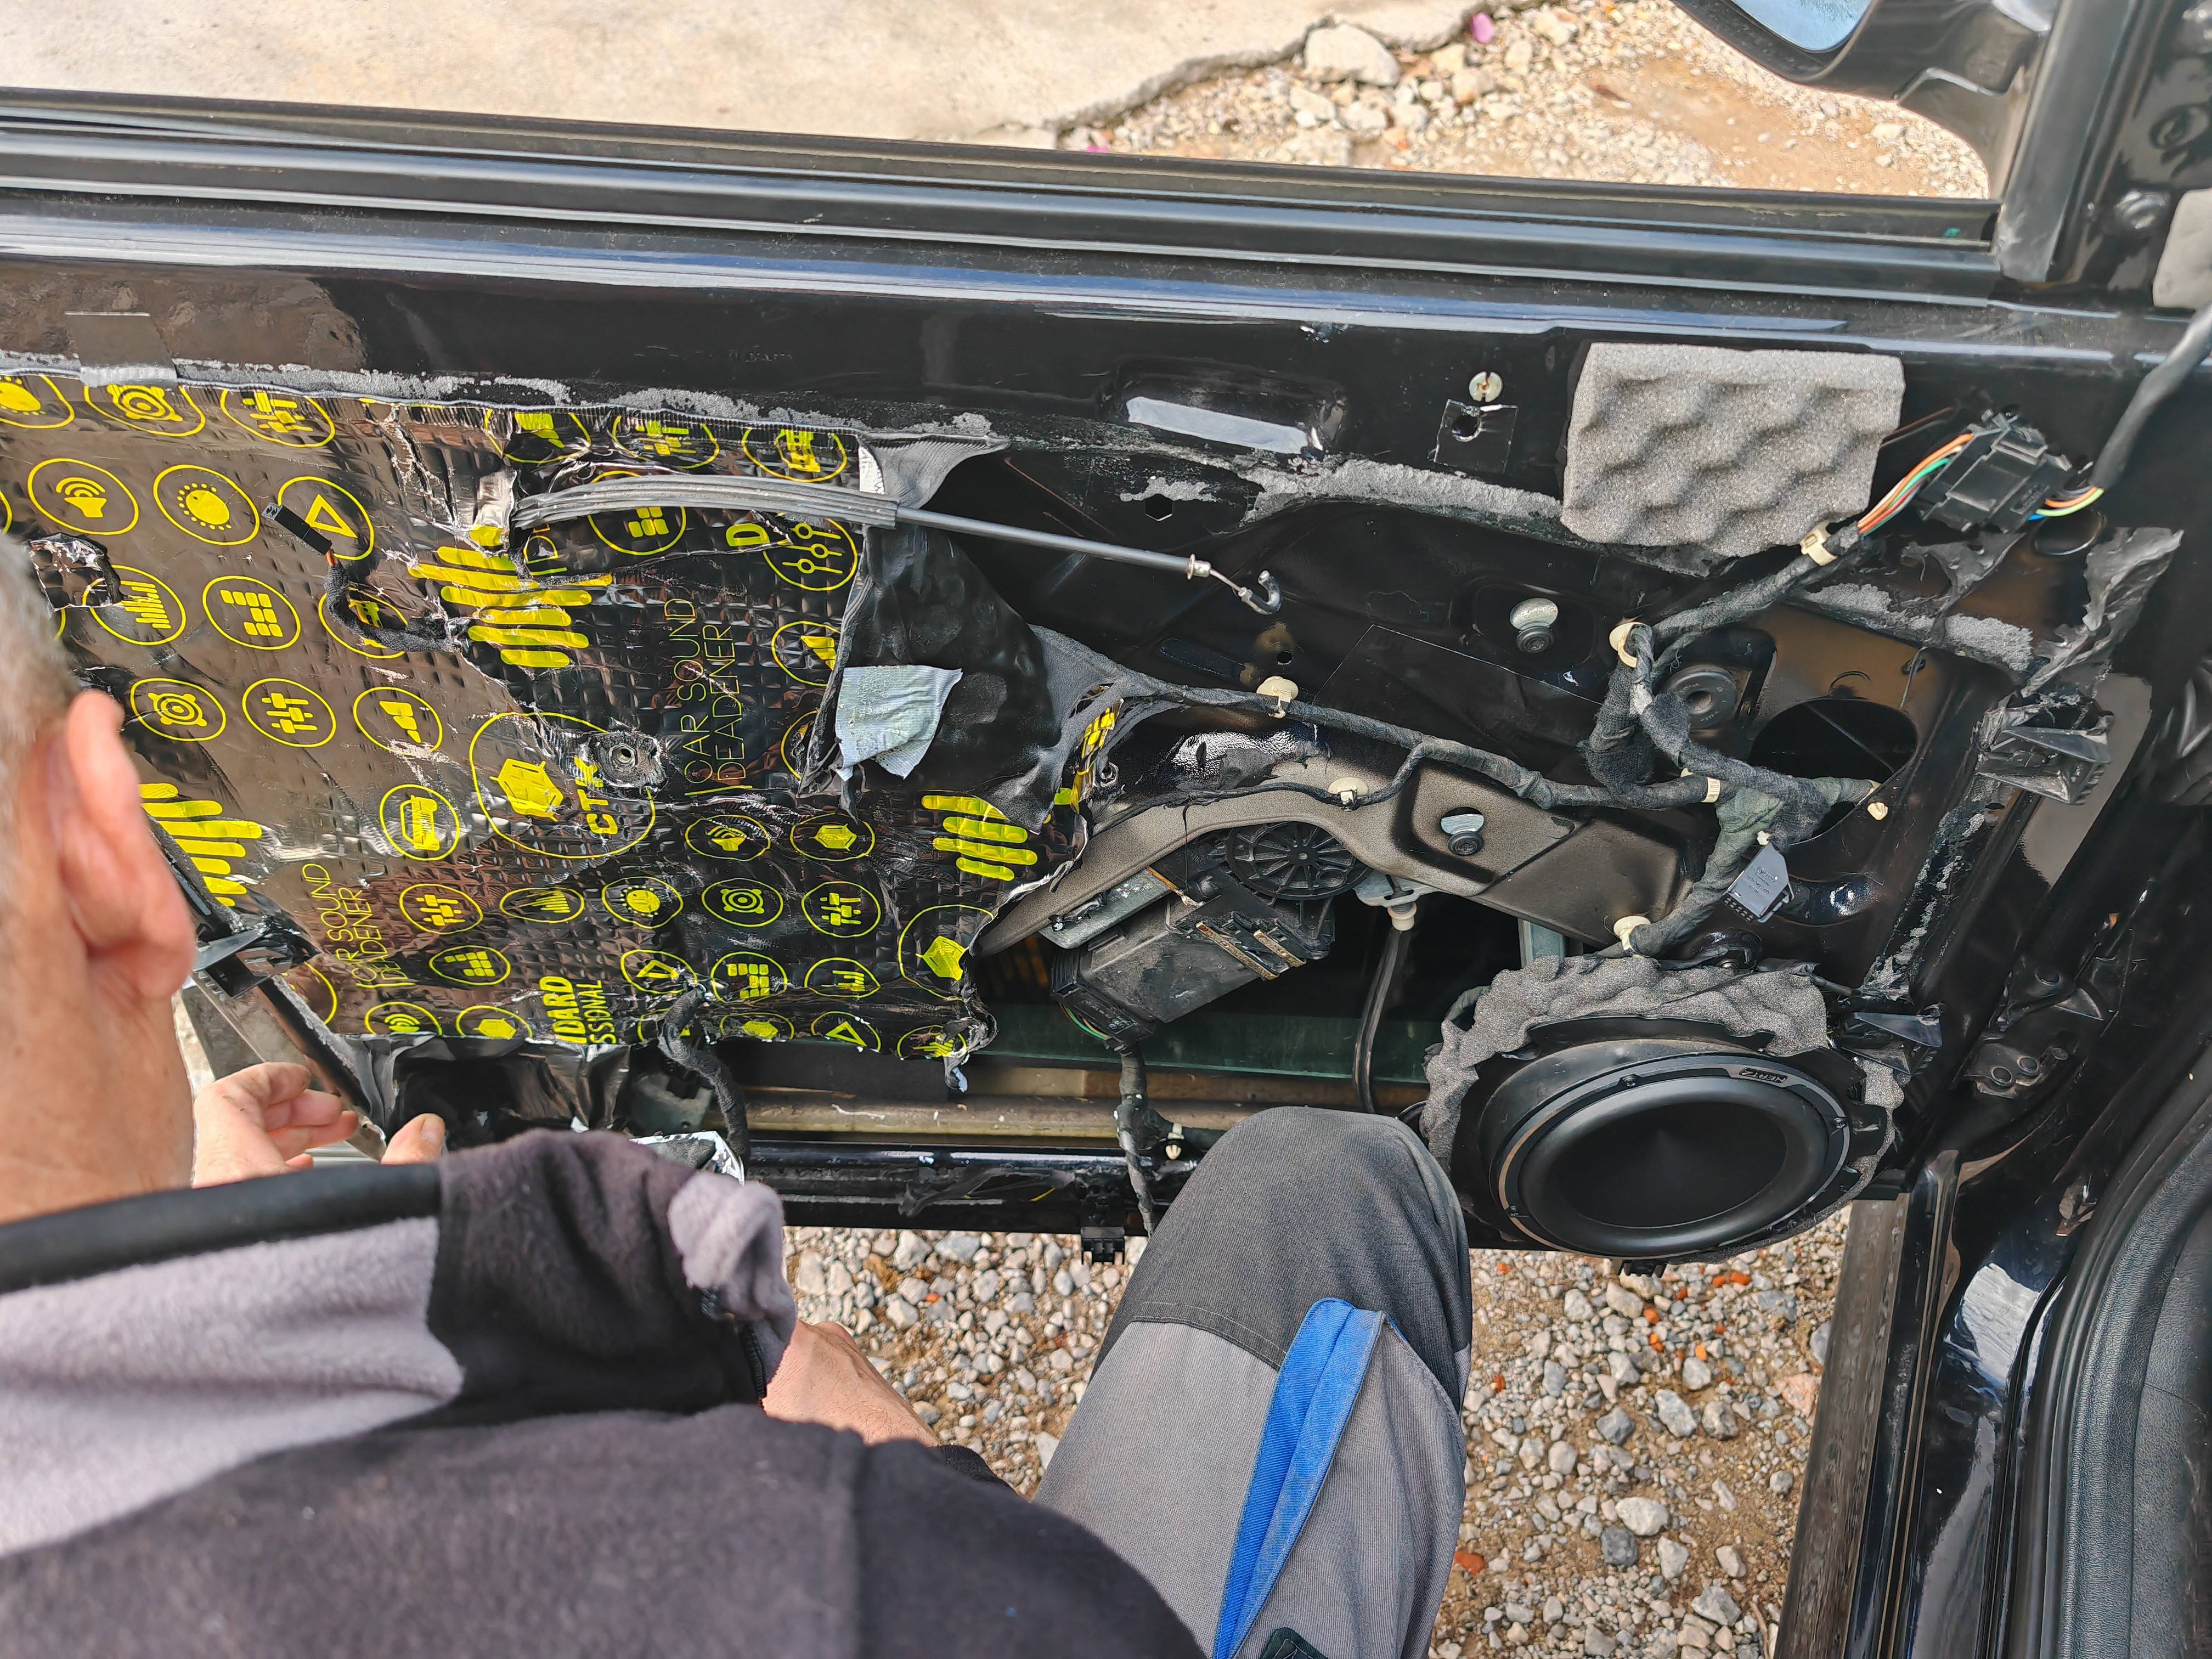
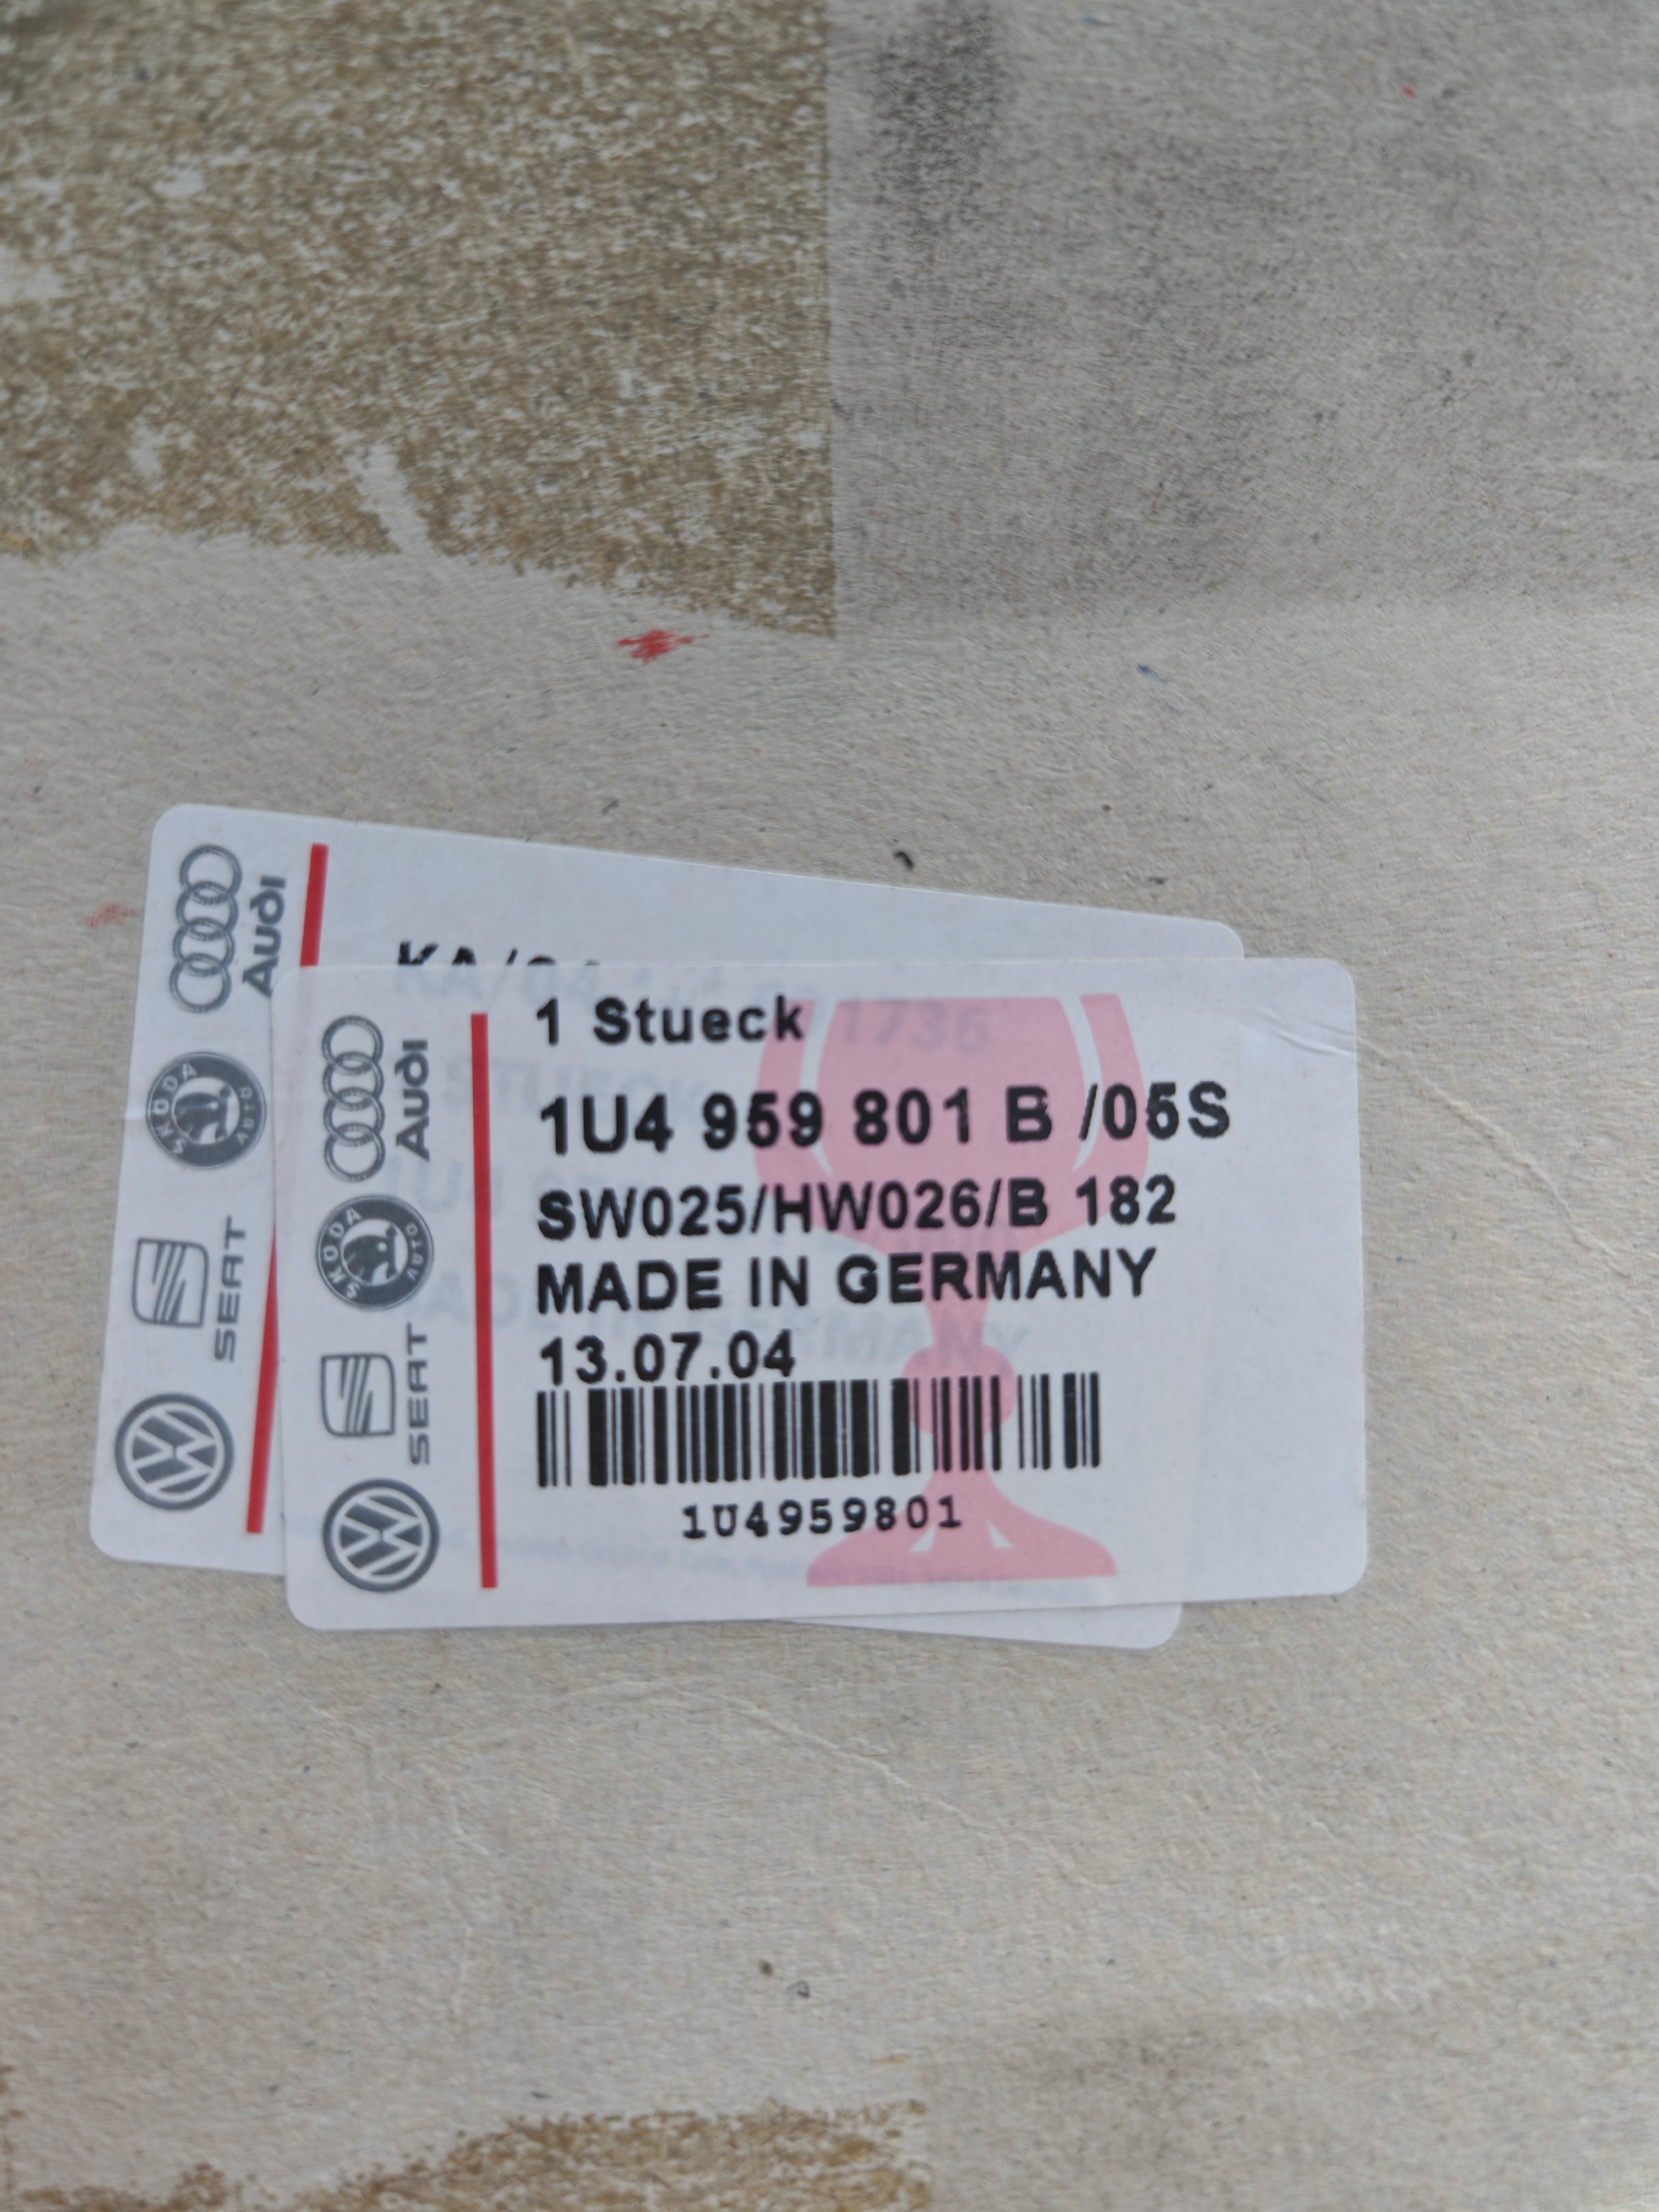
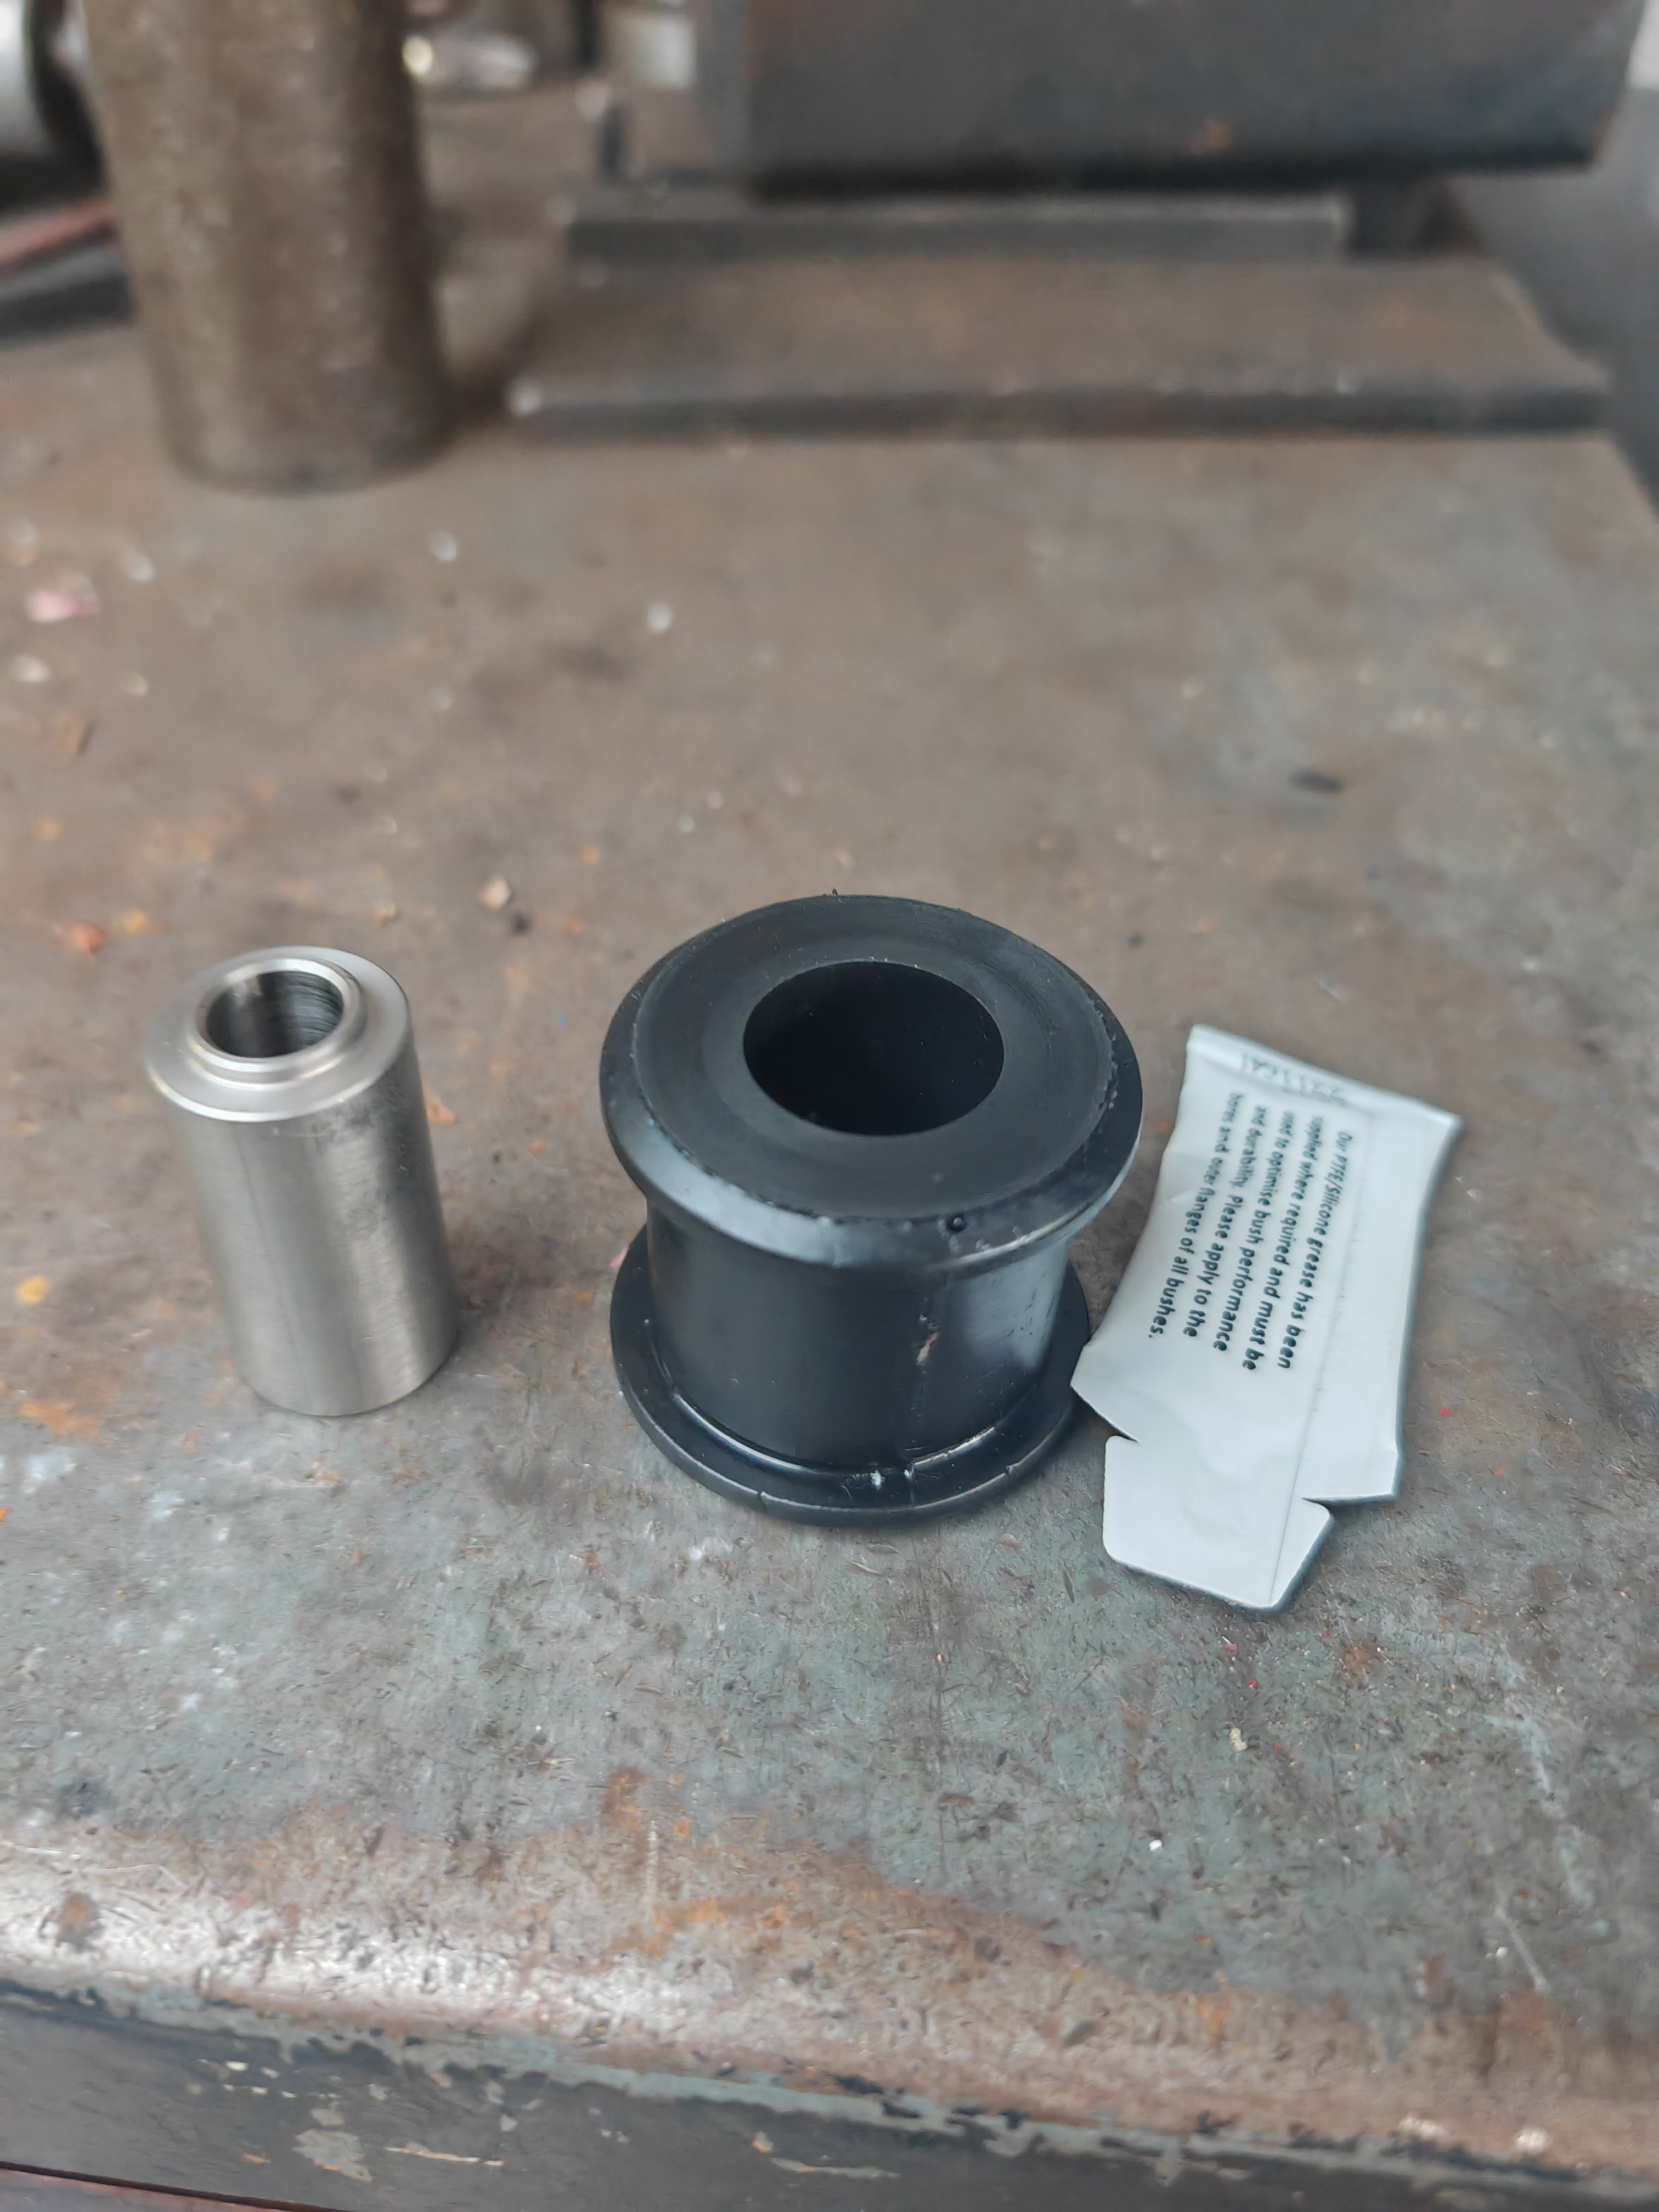
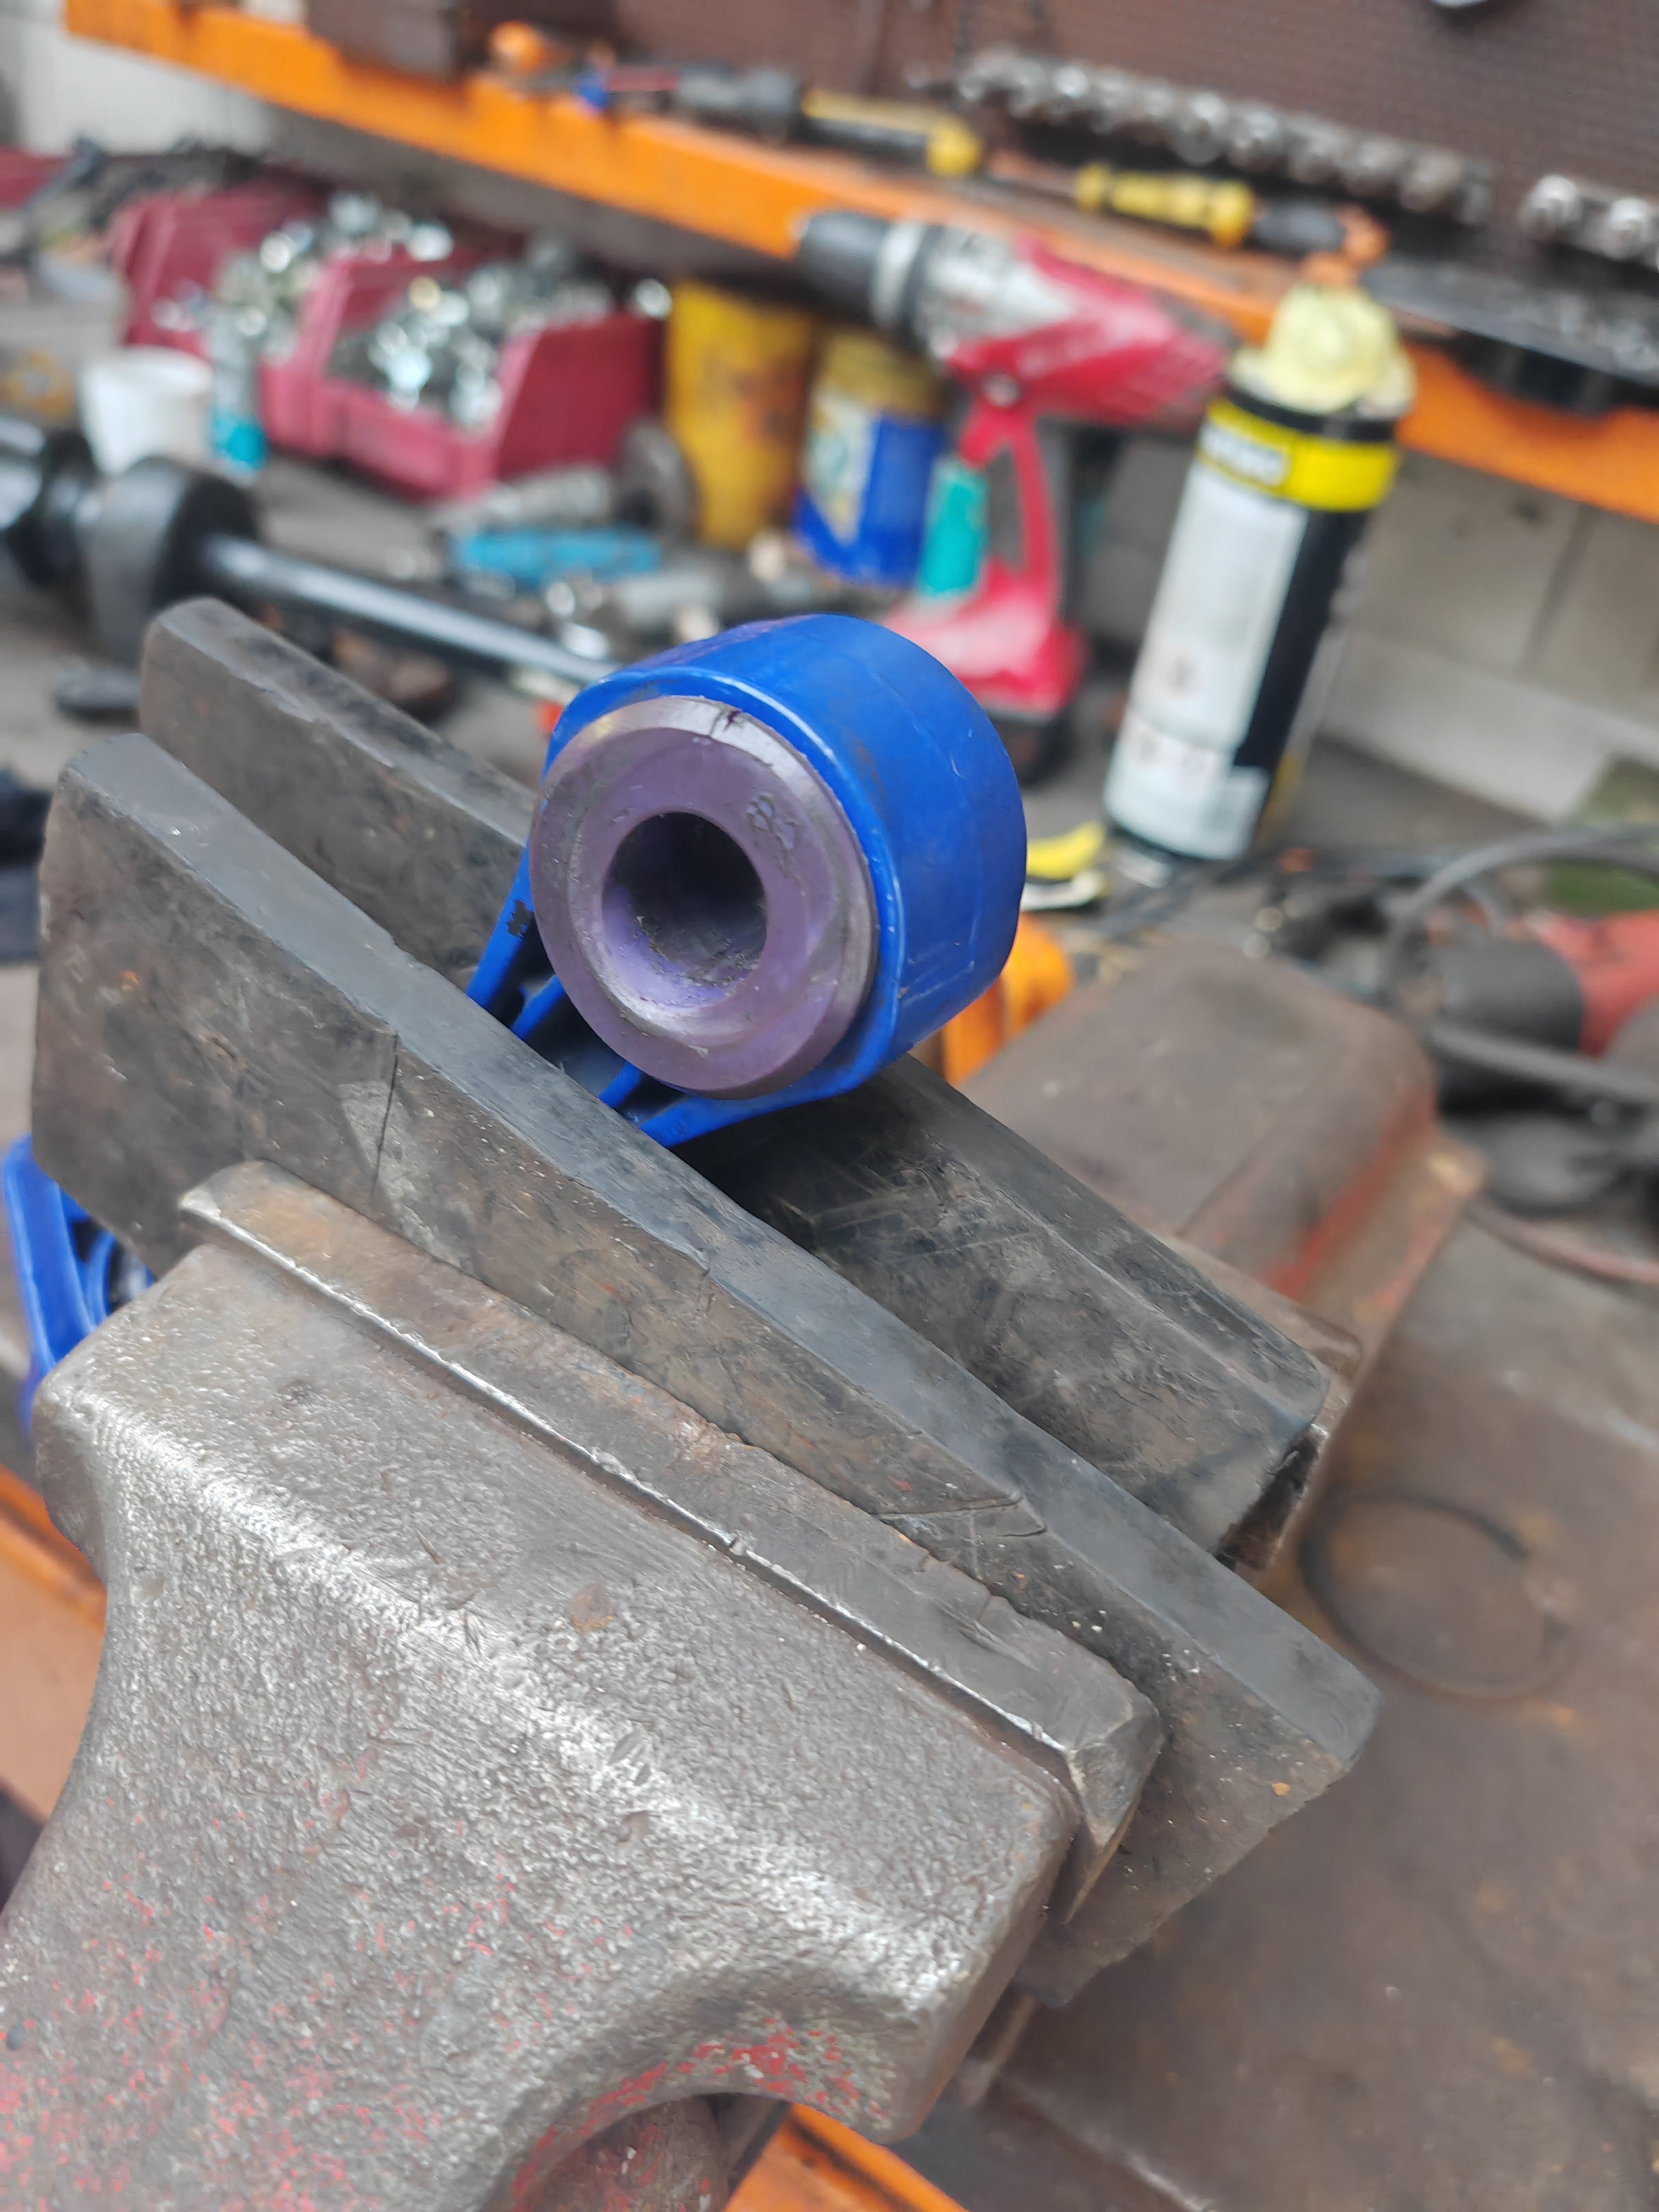
1 pointFinally replaced Windows control module in drivers door-central locking, side mirrors and all 4 Windows are working. Replaced front Dog bone bushing for Powerflex black racing series one Now both are black. Waiting to replace rear Beam old Powerflex for New ones also Powerflex black racing series. Time for New Yokohamas Advsn Neova 08RS


 1 point
 -
Might be vaguely helpful. Launch the MySkoda app or go to the website . Go to "inspect", then "car details" and at the bottom there's "download a digital certificate". It shows lots of stuff, including services. It also shows other work, and parts for non service work. My certificate runs to ten pages. So I even know I had some "quantum mix water" at one point. That's cheering at least.1 point
-
How much did you pay, wiper, battery and seat belt excluded? Did they offer any lube? I'd be asking for a refund for any work not yet completed, buy a £100-150 battery off eurocarparts in the exact spec required and have it fitted and coded for free at the nearest independent that will now do your actual service. Wiper is under £10 on ebay btw One thing to note, resetting inspection resets service interval as well, i don't think they had much of a choice there1 point
-
1 pointHope you don’t mind me indulging. Been working on a Victorian gatehouse for a couple of years now, with the roof taking up a large chunk of that time. My son and I have been working with a slater, sorting, holing and cutting bullets out of Welsh slate. The slater does the final sorting and fixing to the roof. The bullets are all done and the last few slate are going on Monday with the roof all completed by the end of next week. We are really pleased with how it’s turned out, with lots of compliments from the locals, though less so from other trades people.. “what you doing all that fancy crap for?..” Still got a way go go with the whole project but another milestone reached.


 1 point
 -
Which is a lovely offer More generally though people can also email [email protected] (with your Reg No and/or VIN) to request the digital record, in my case they took around 5 days to provide it which I don't think is too shabby1 point
-
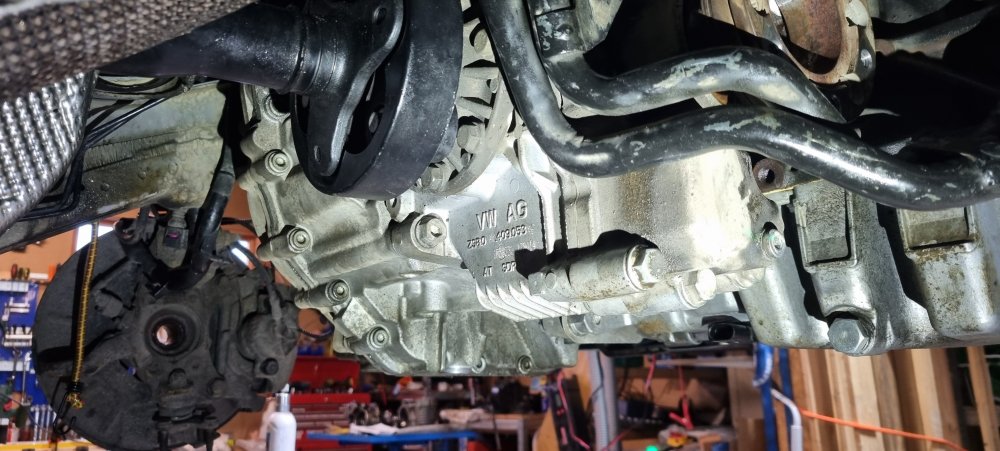
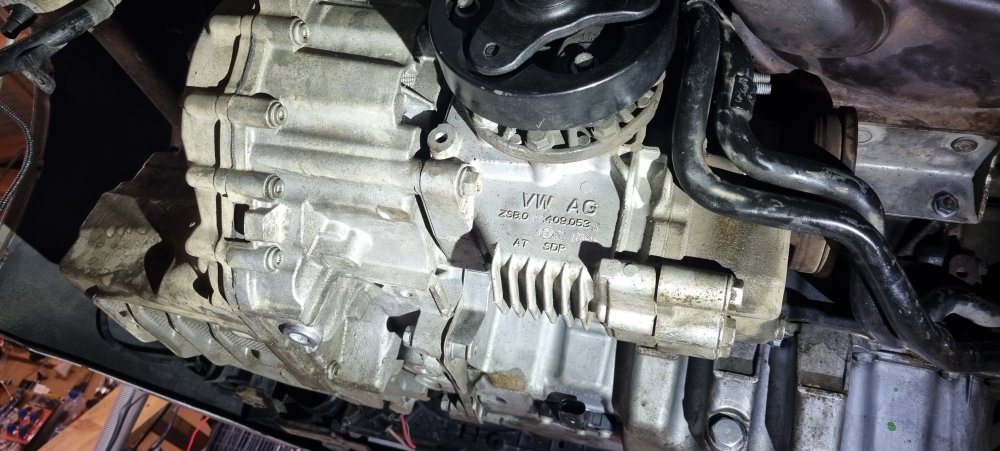
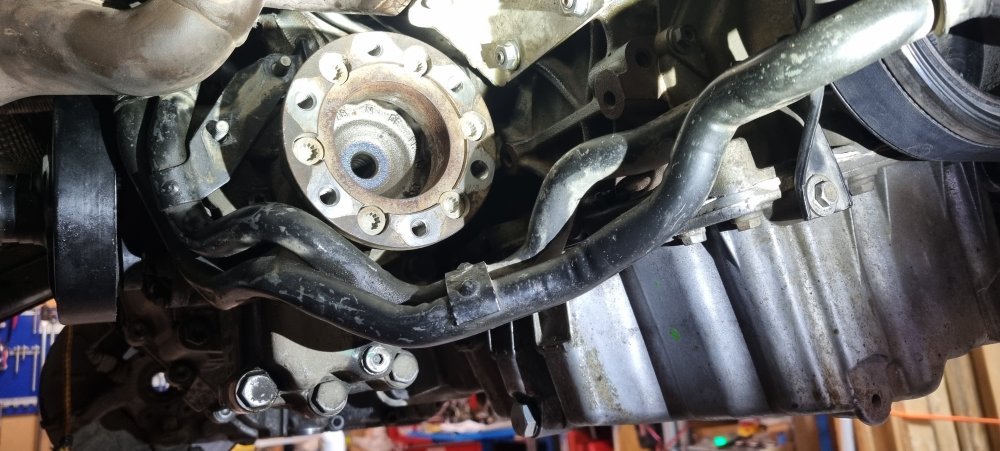
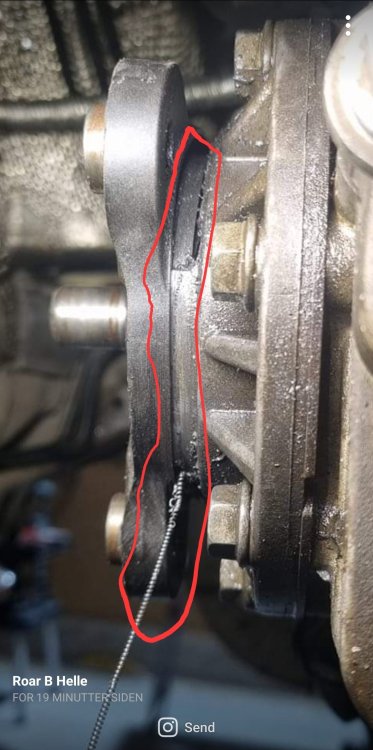
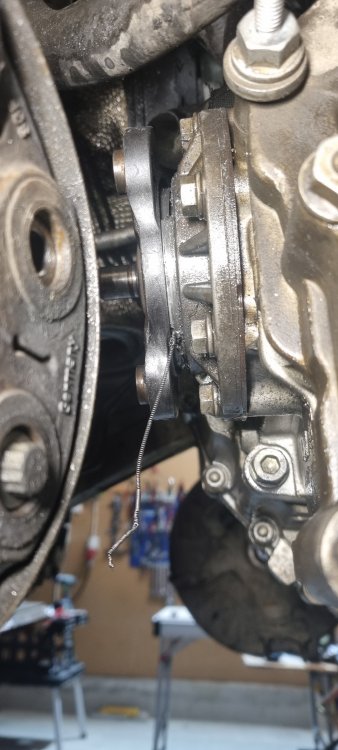
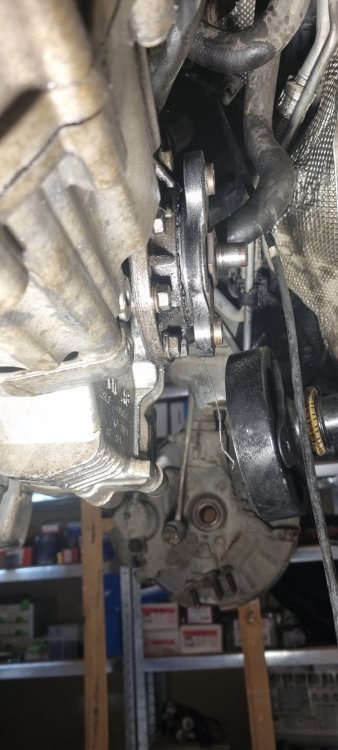
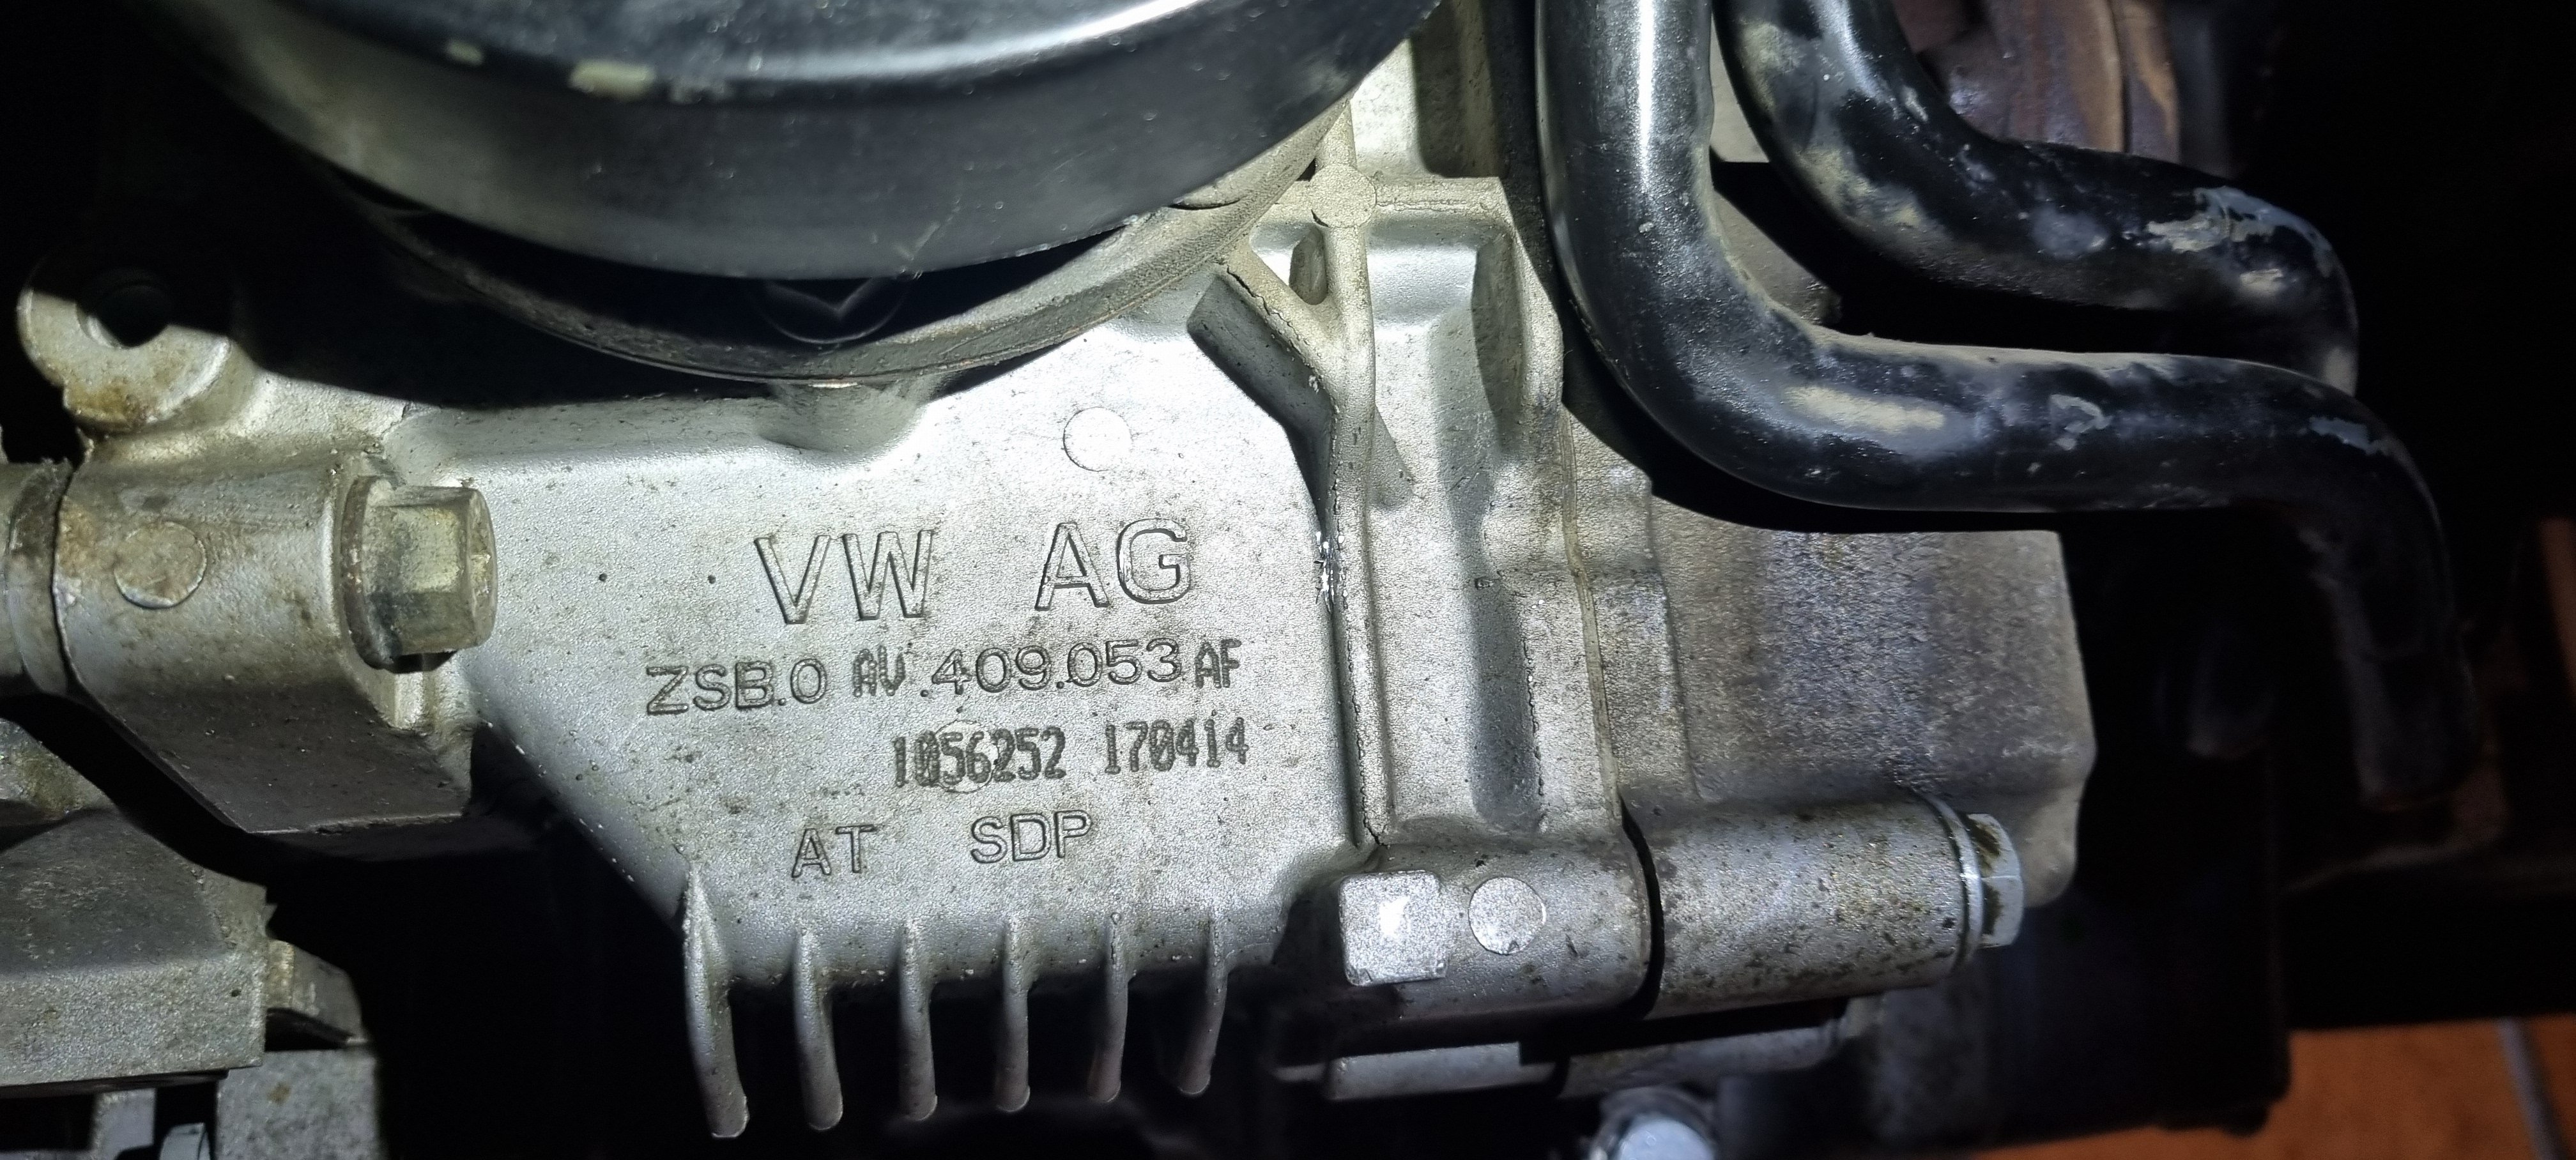
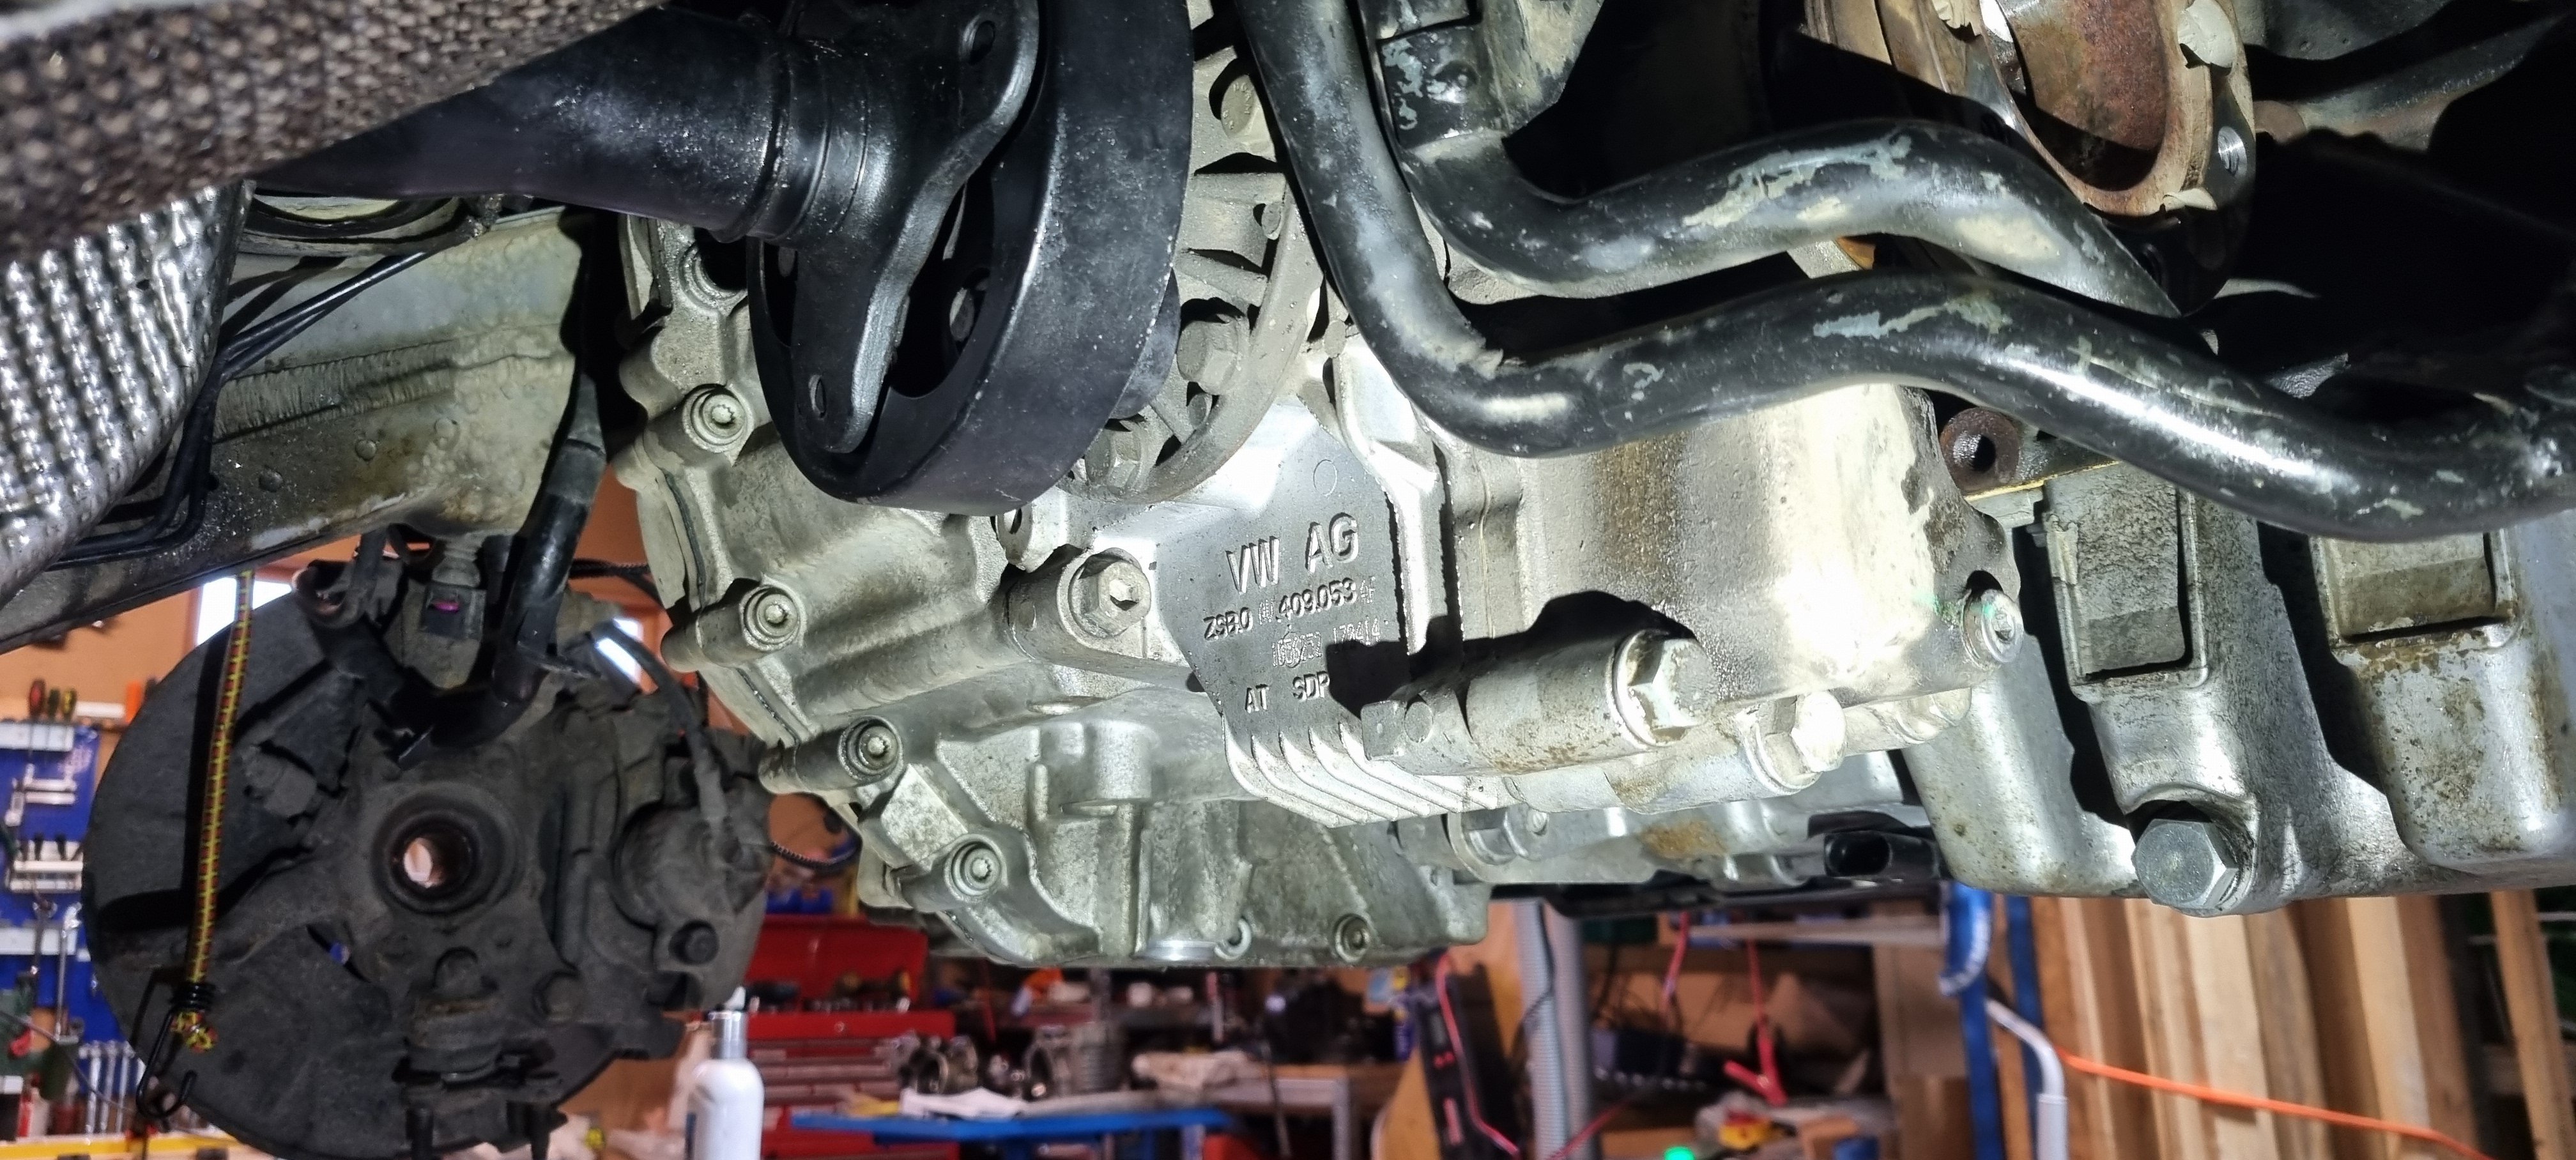
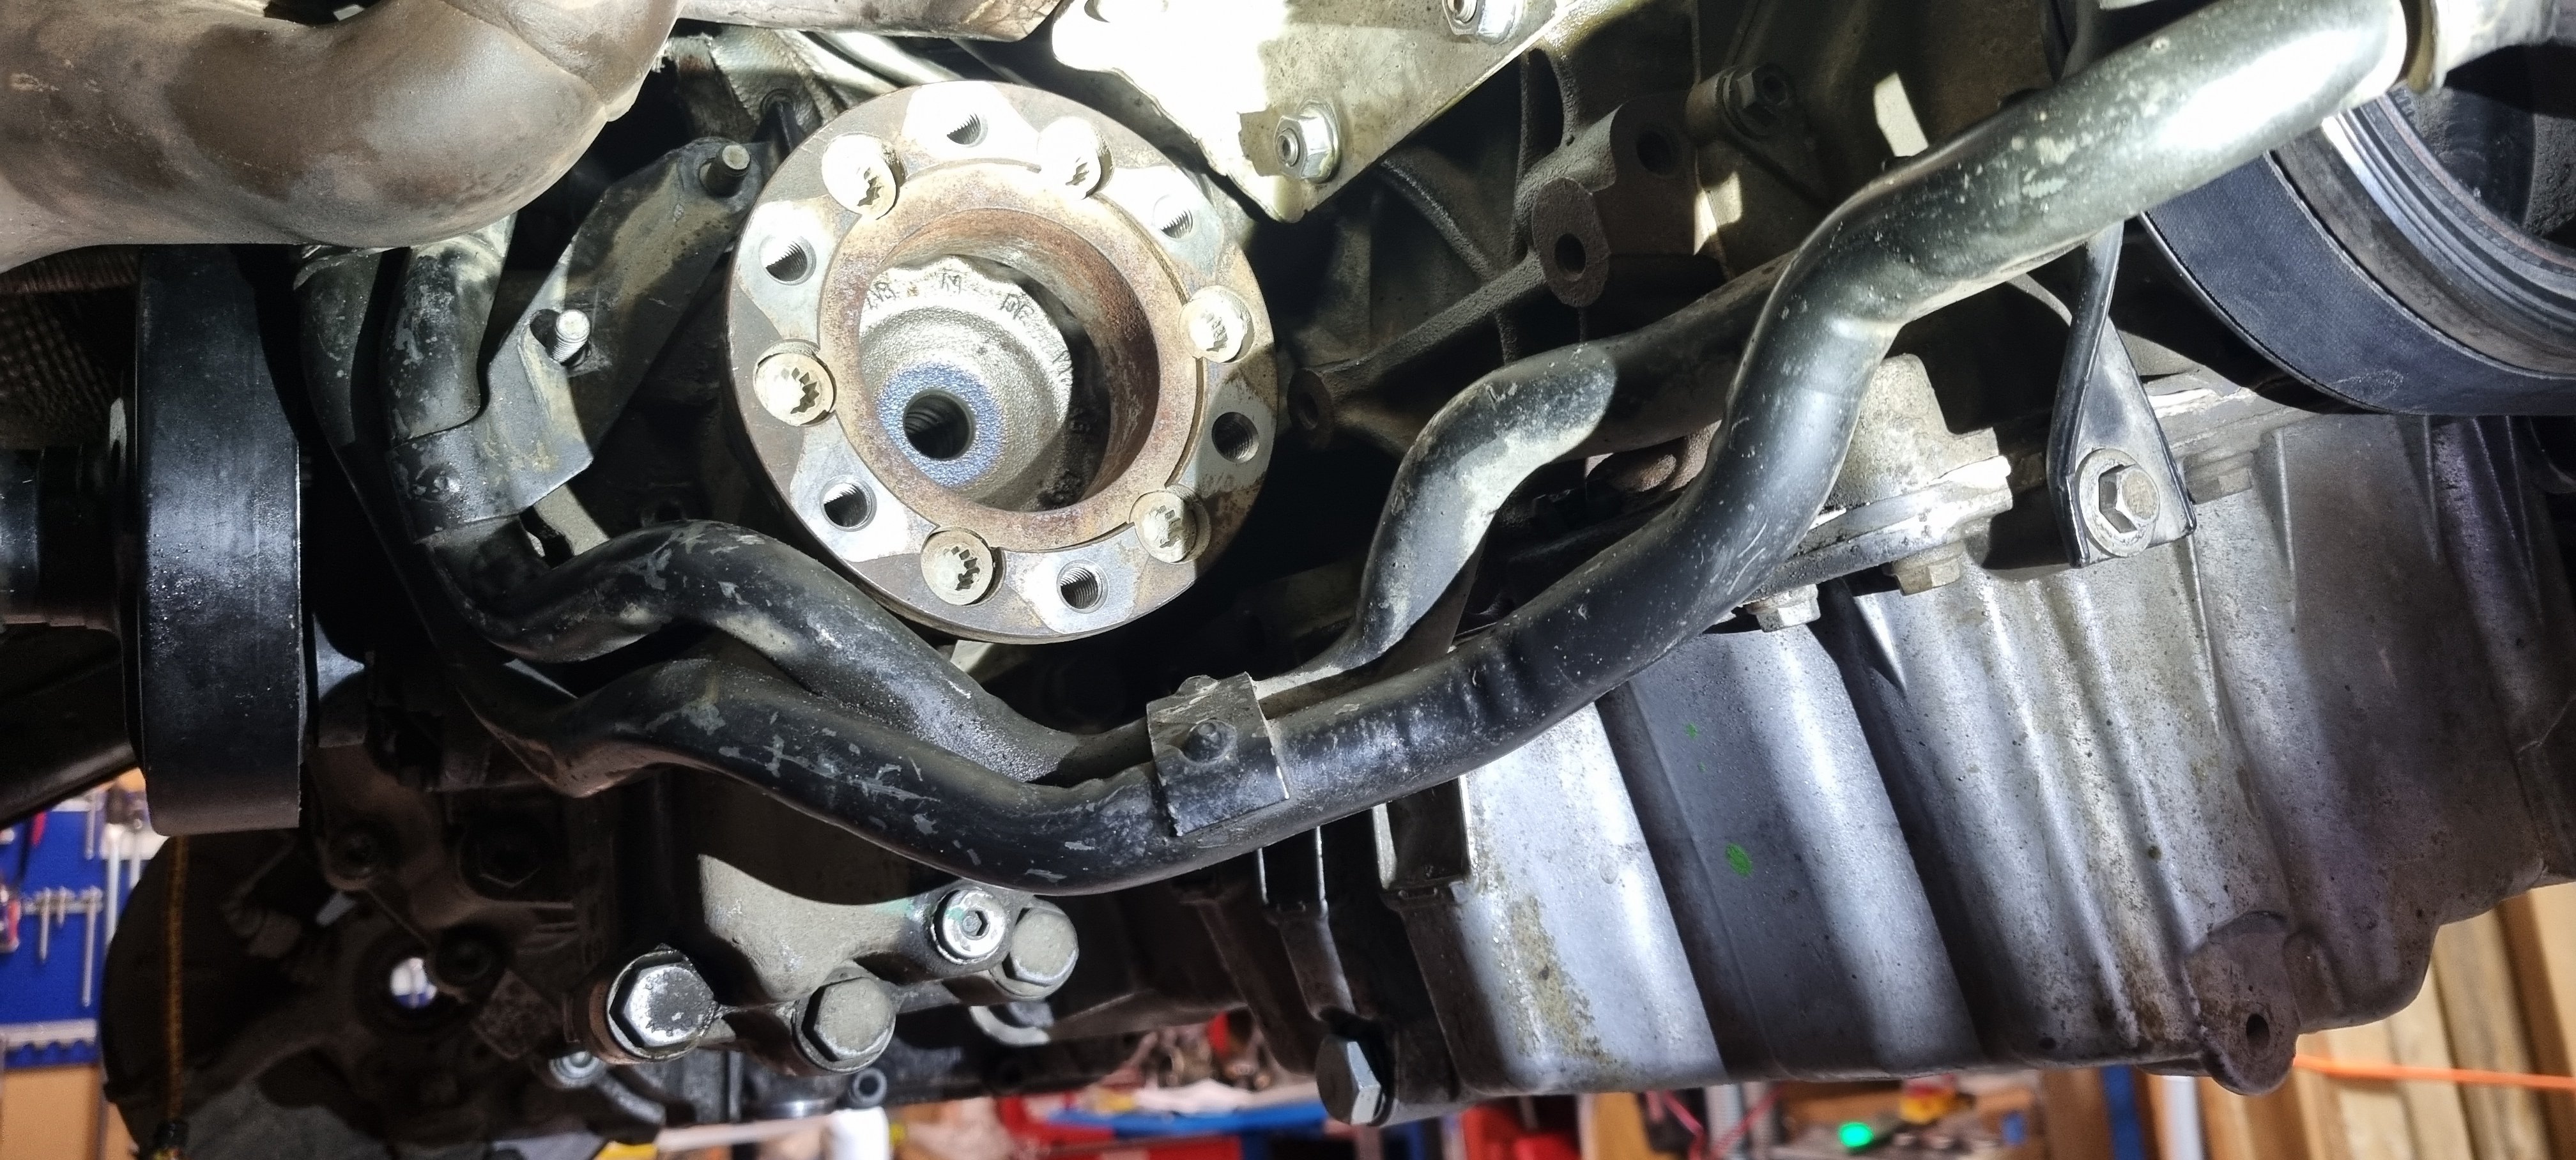
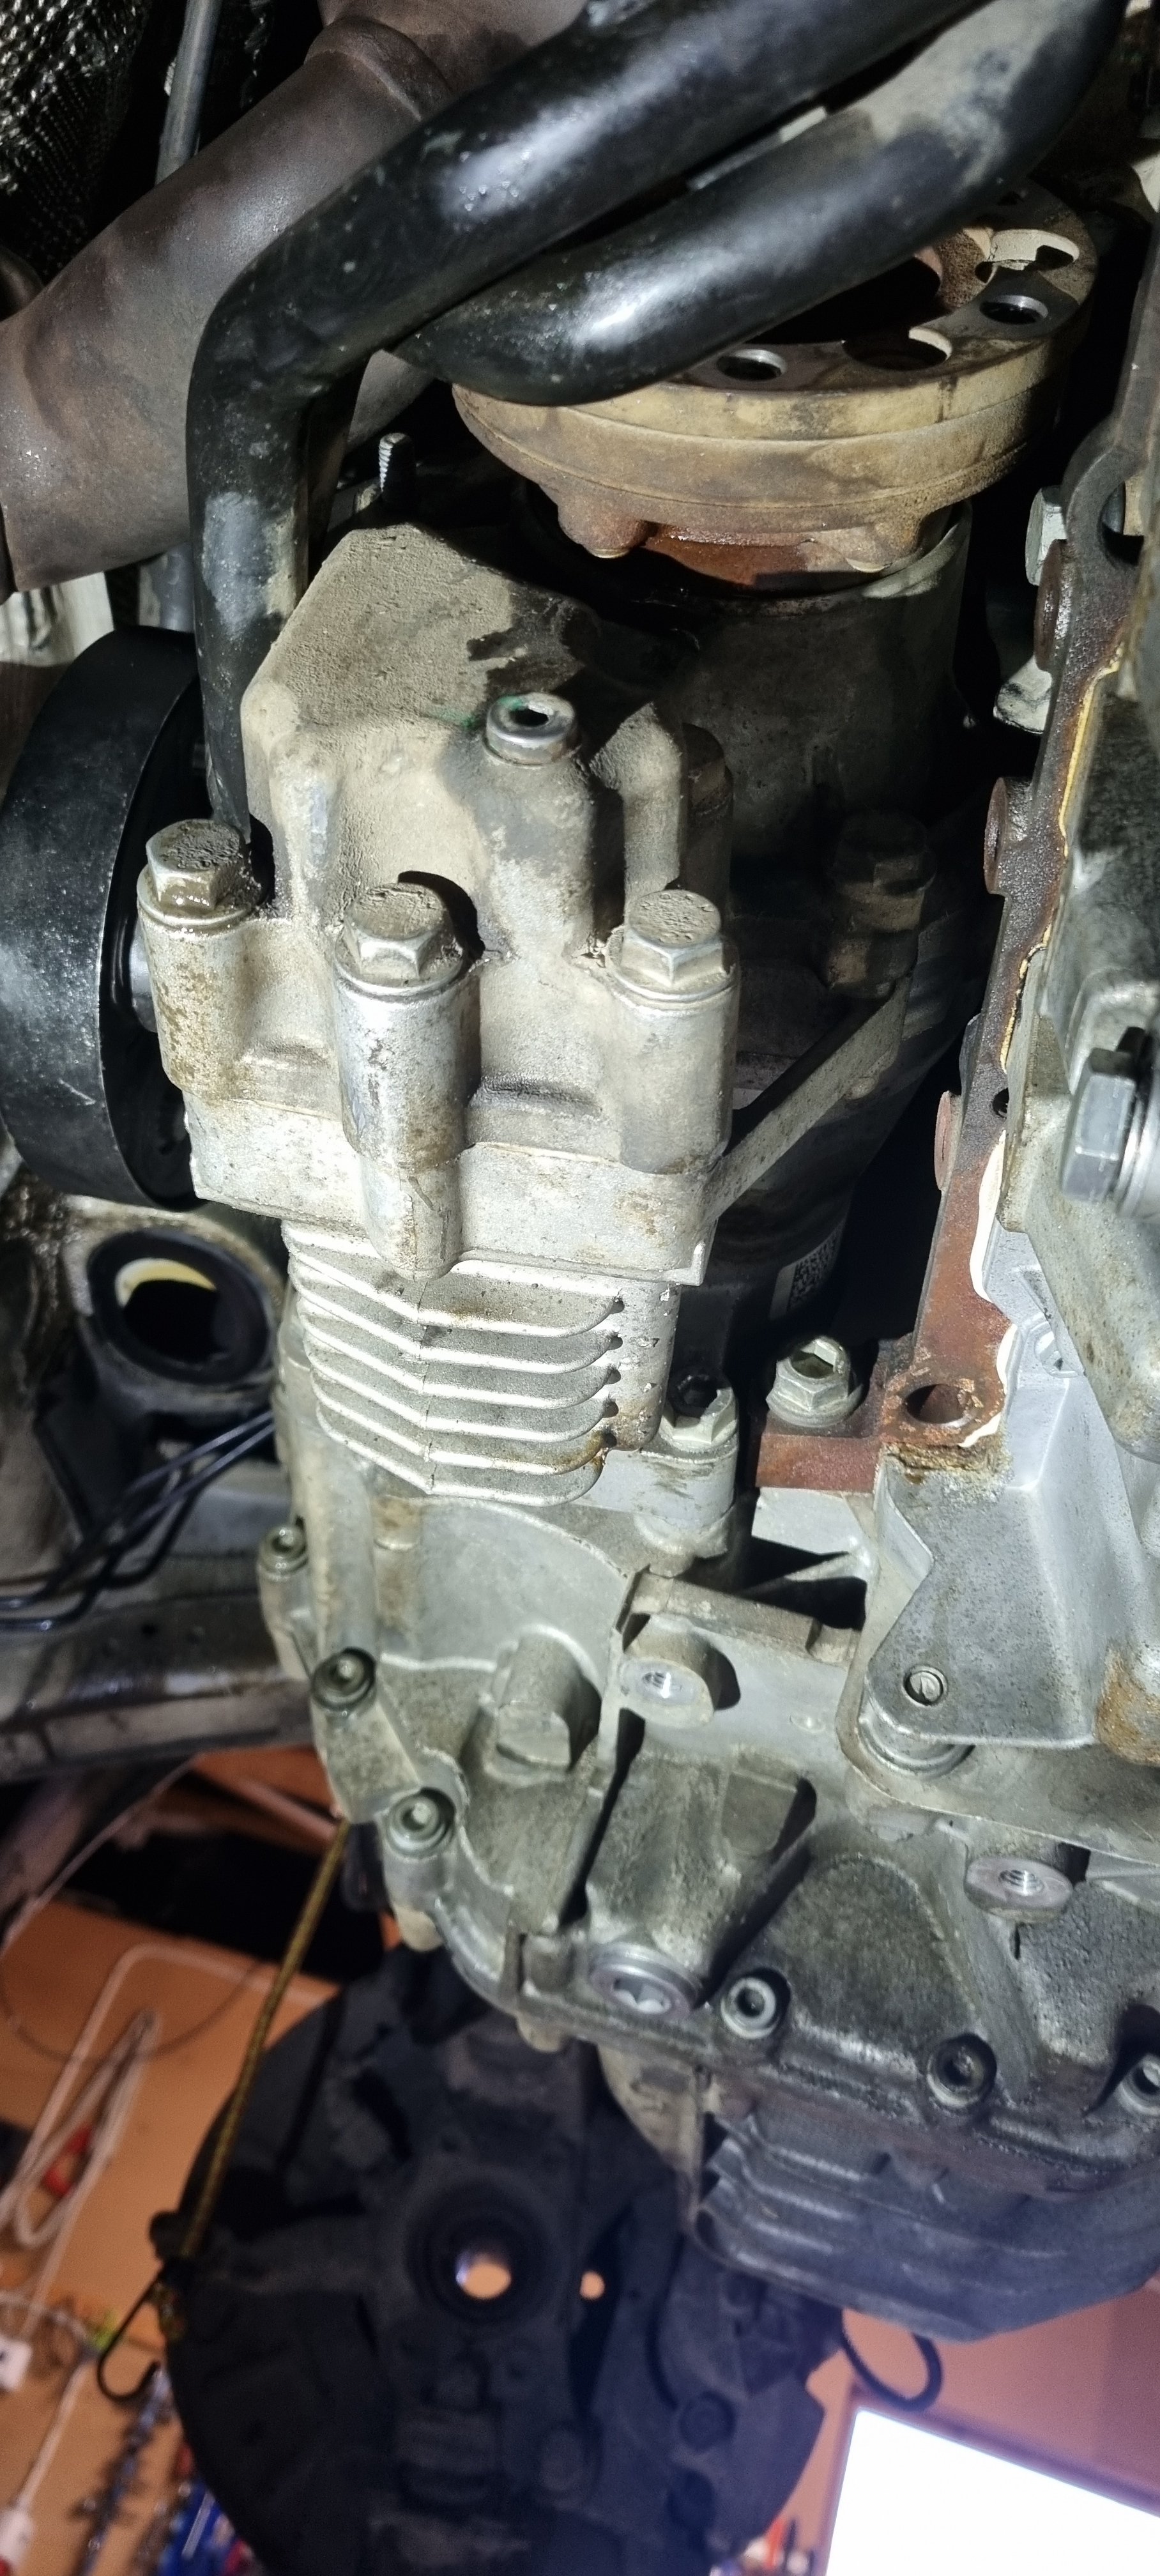
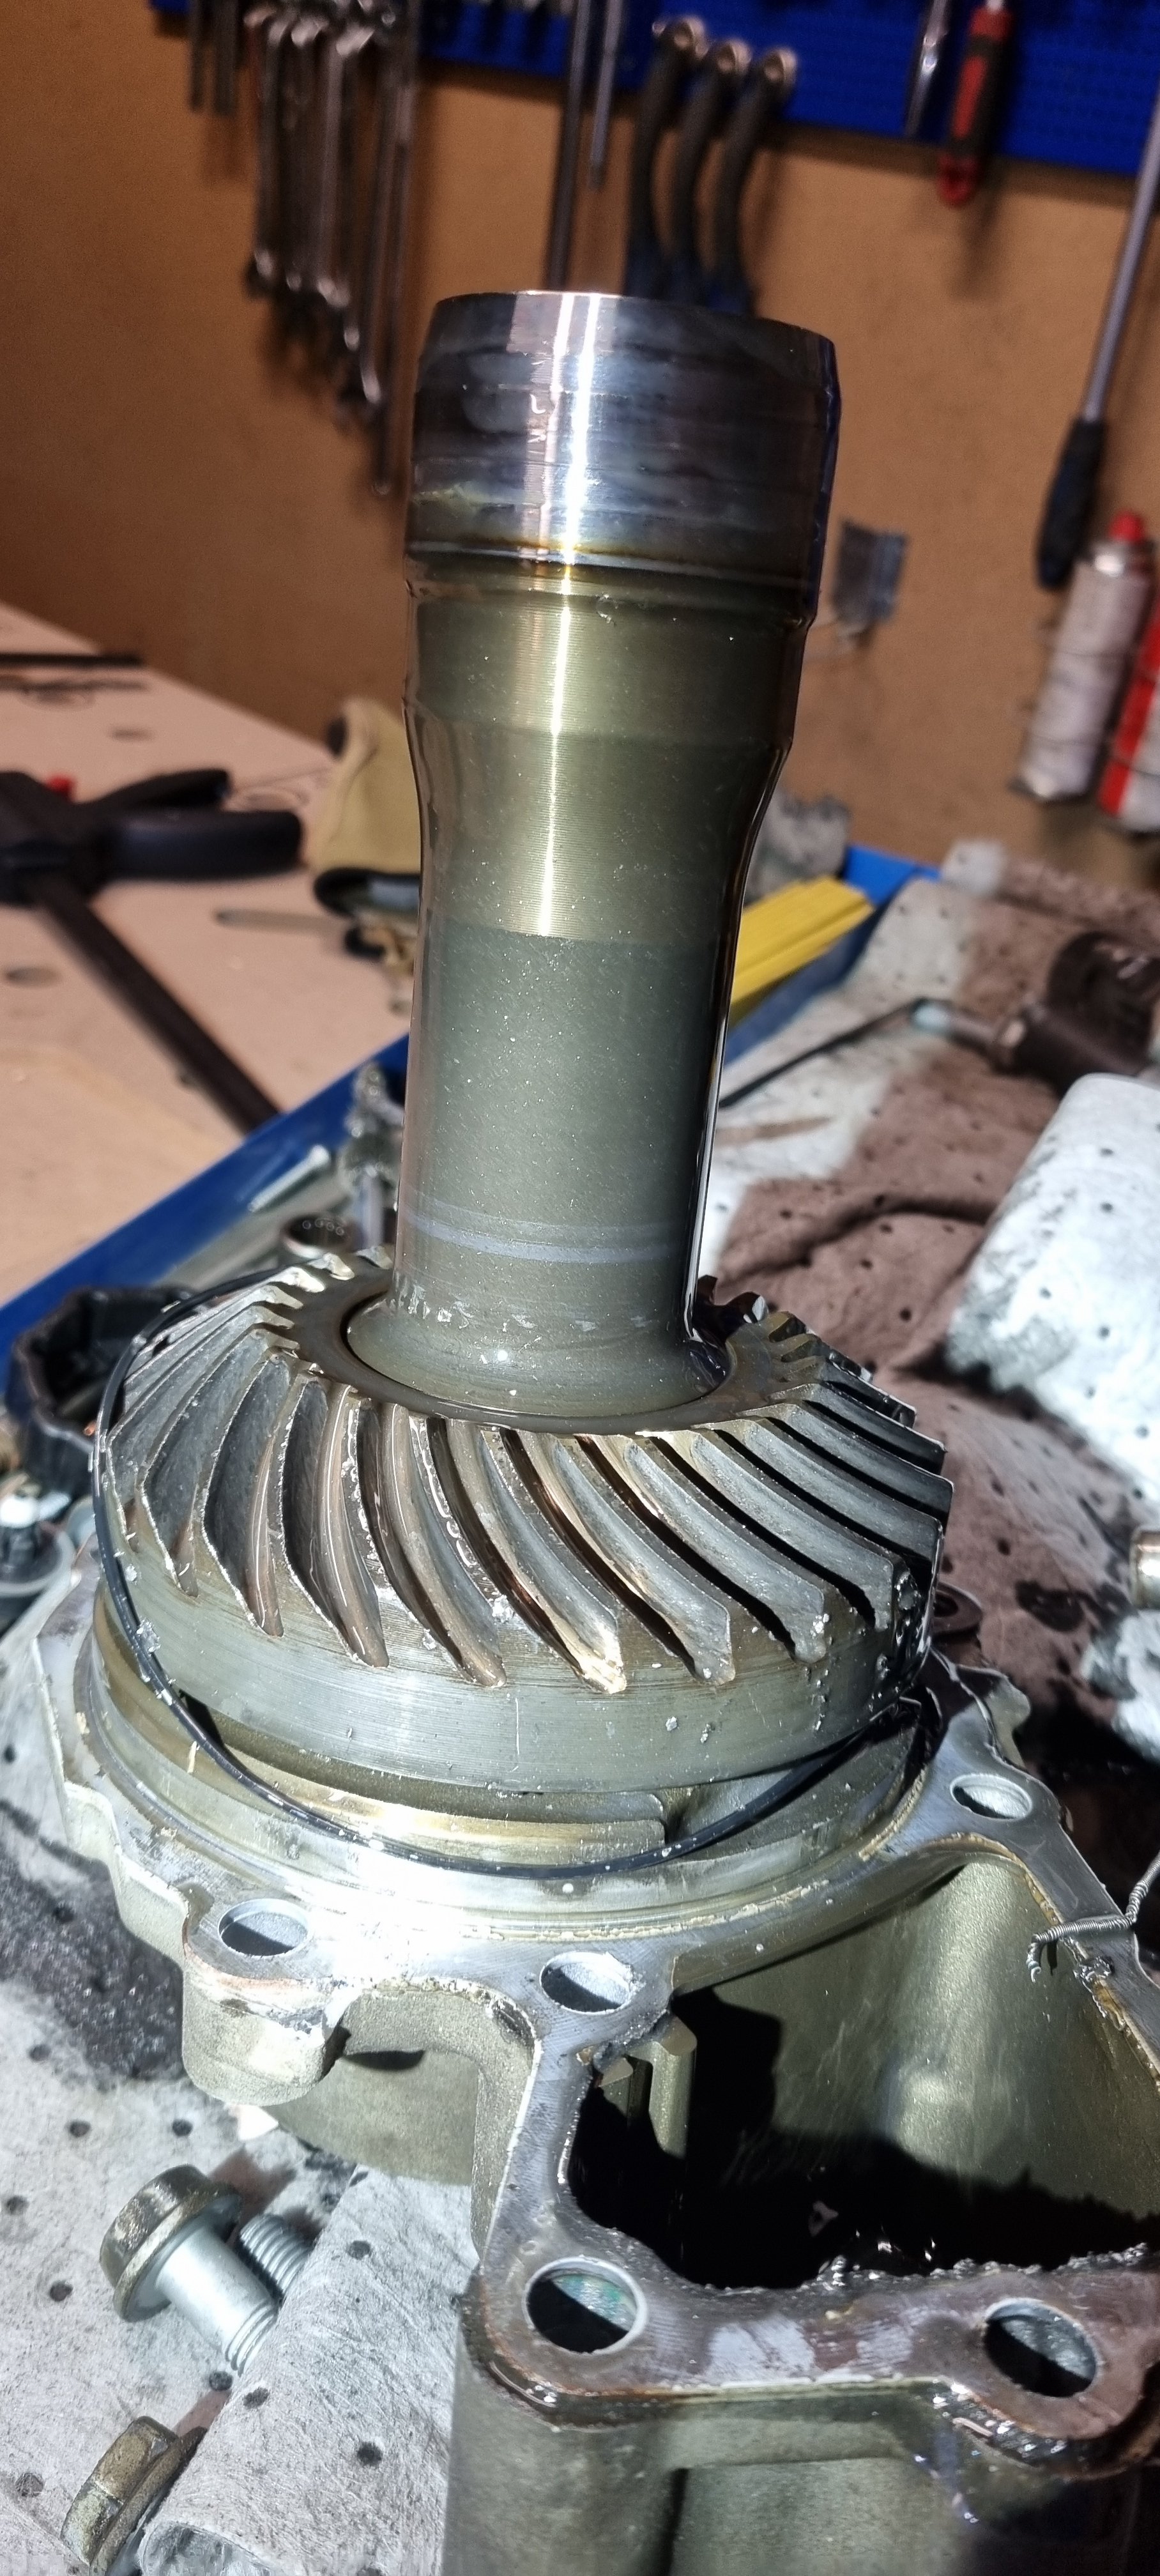
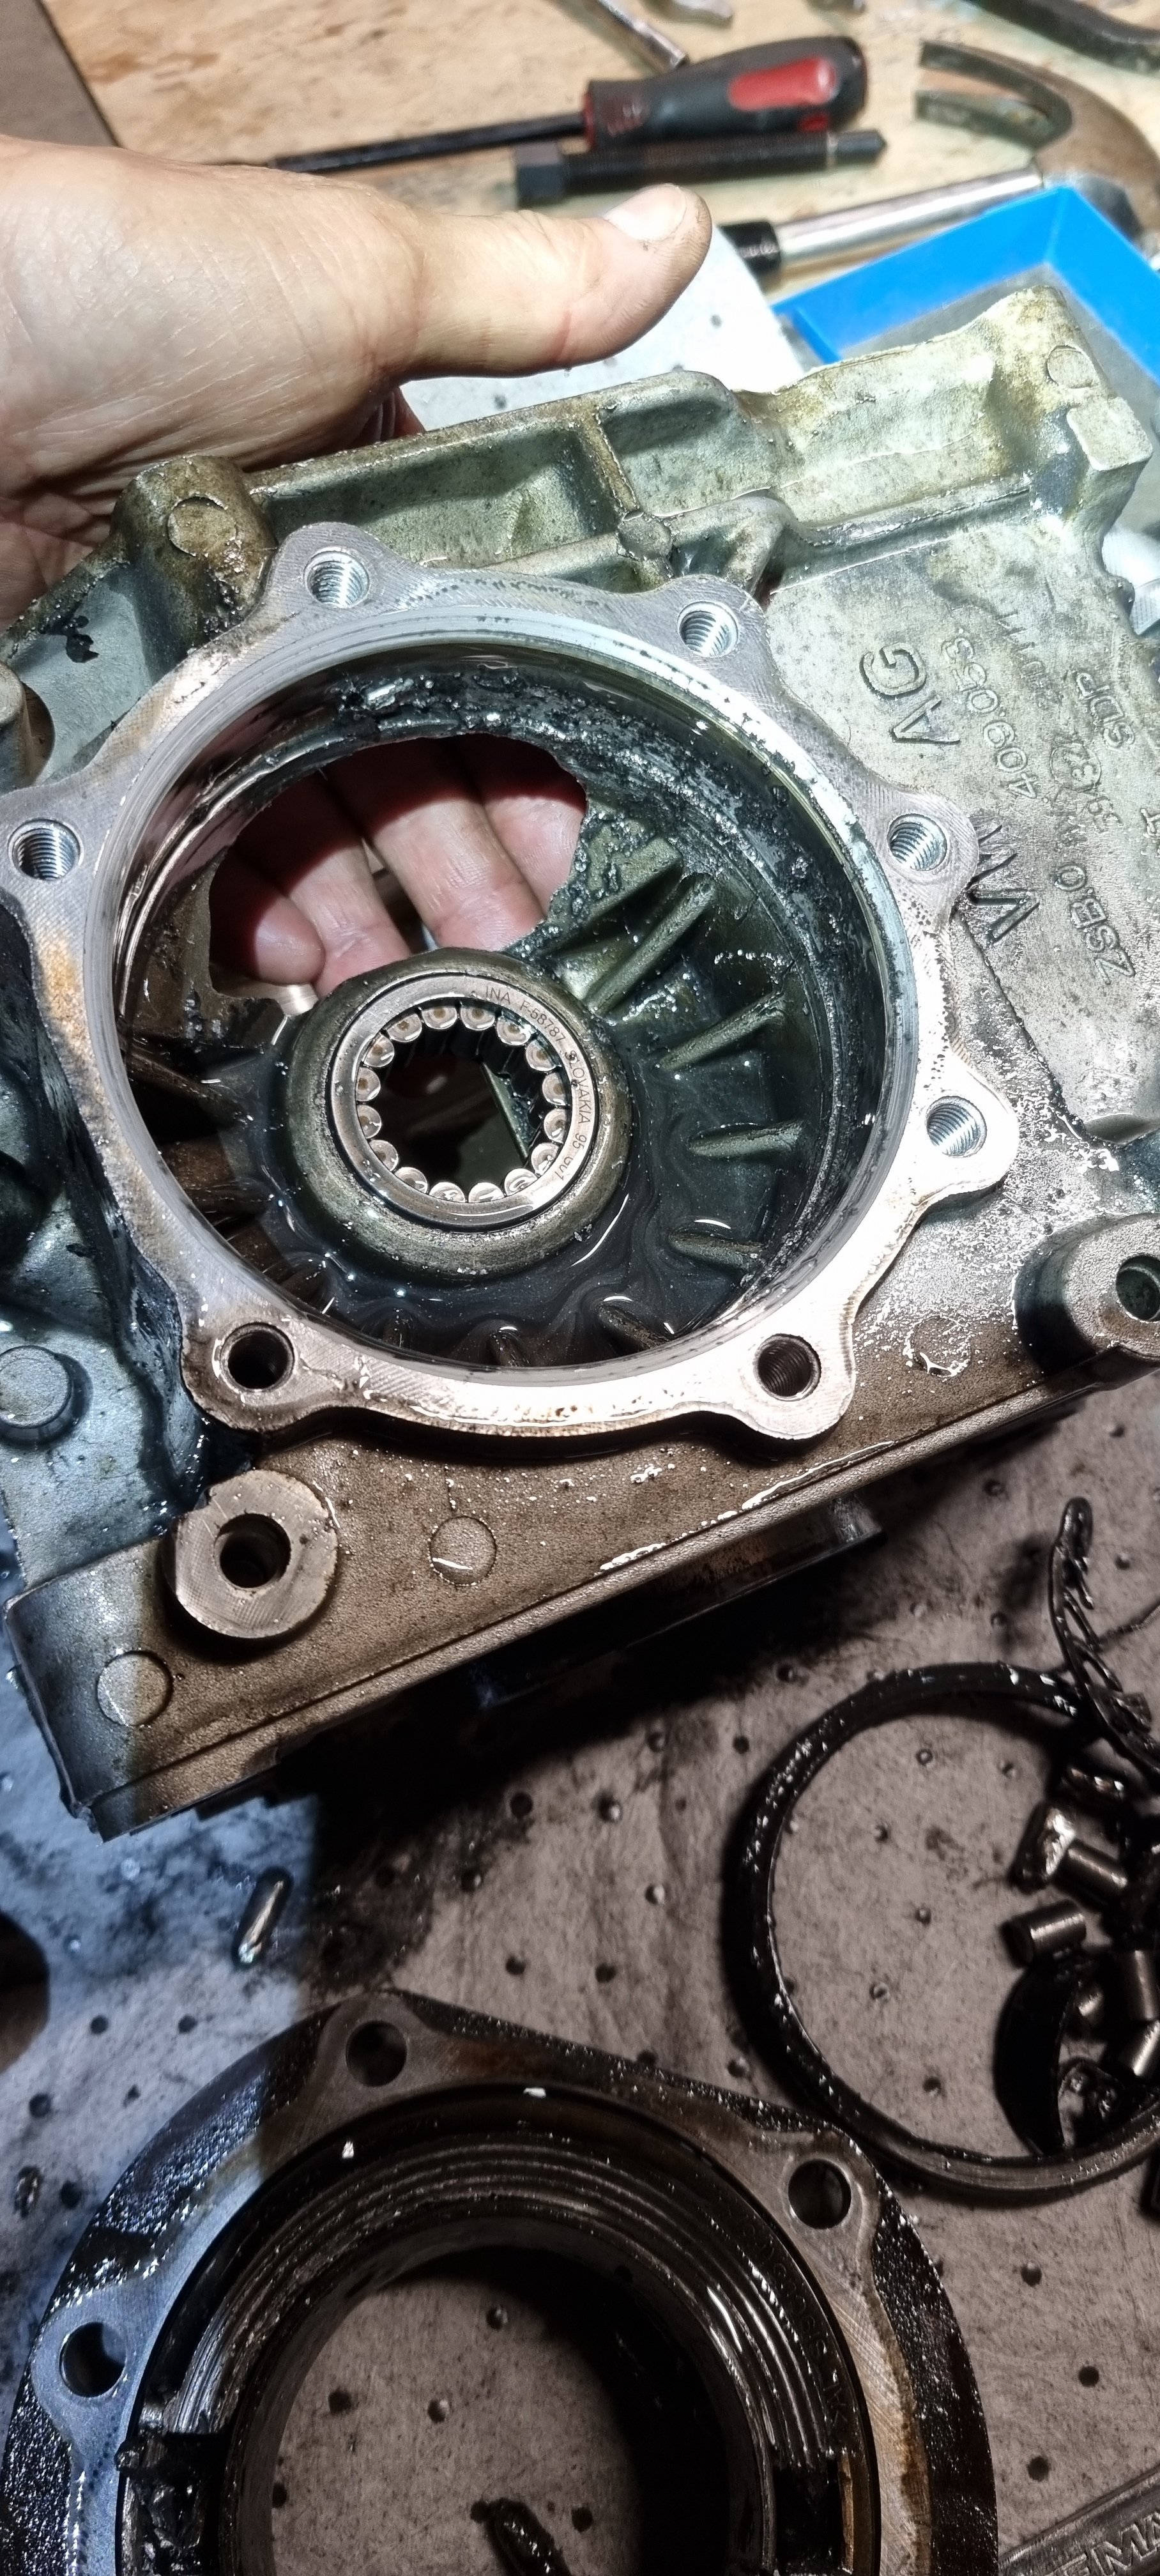
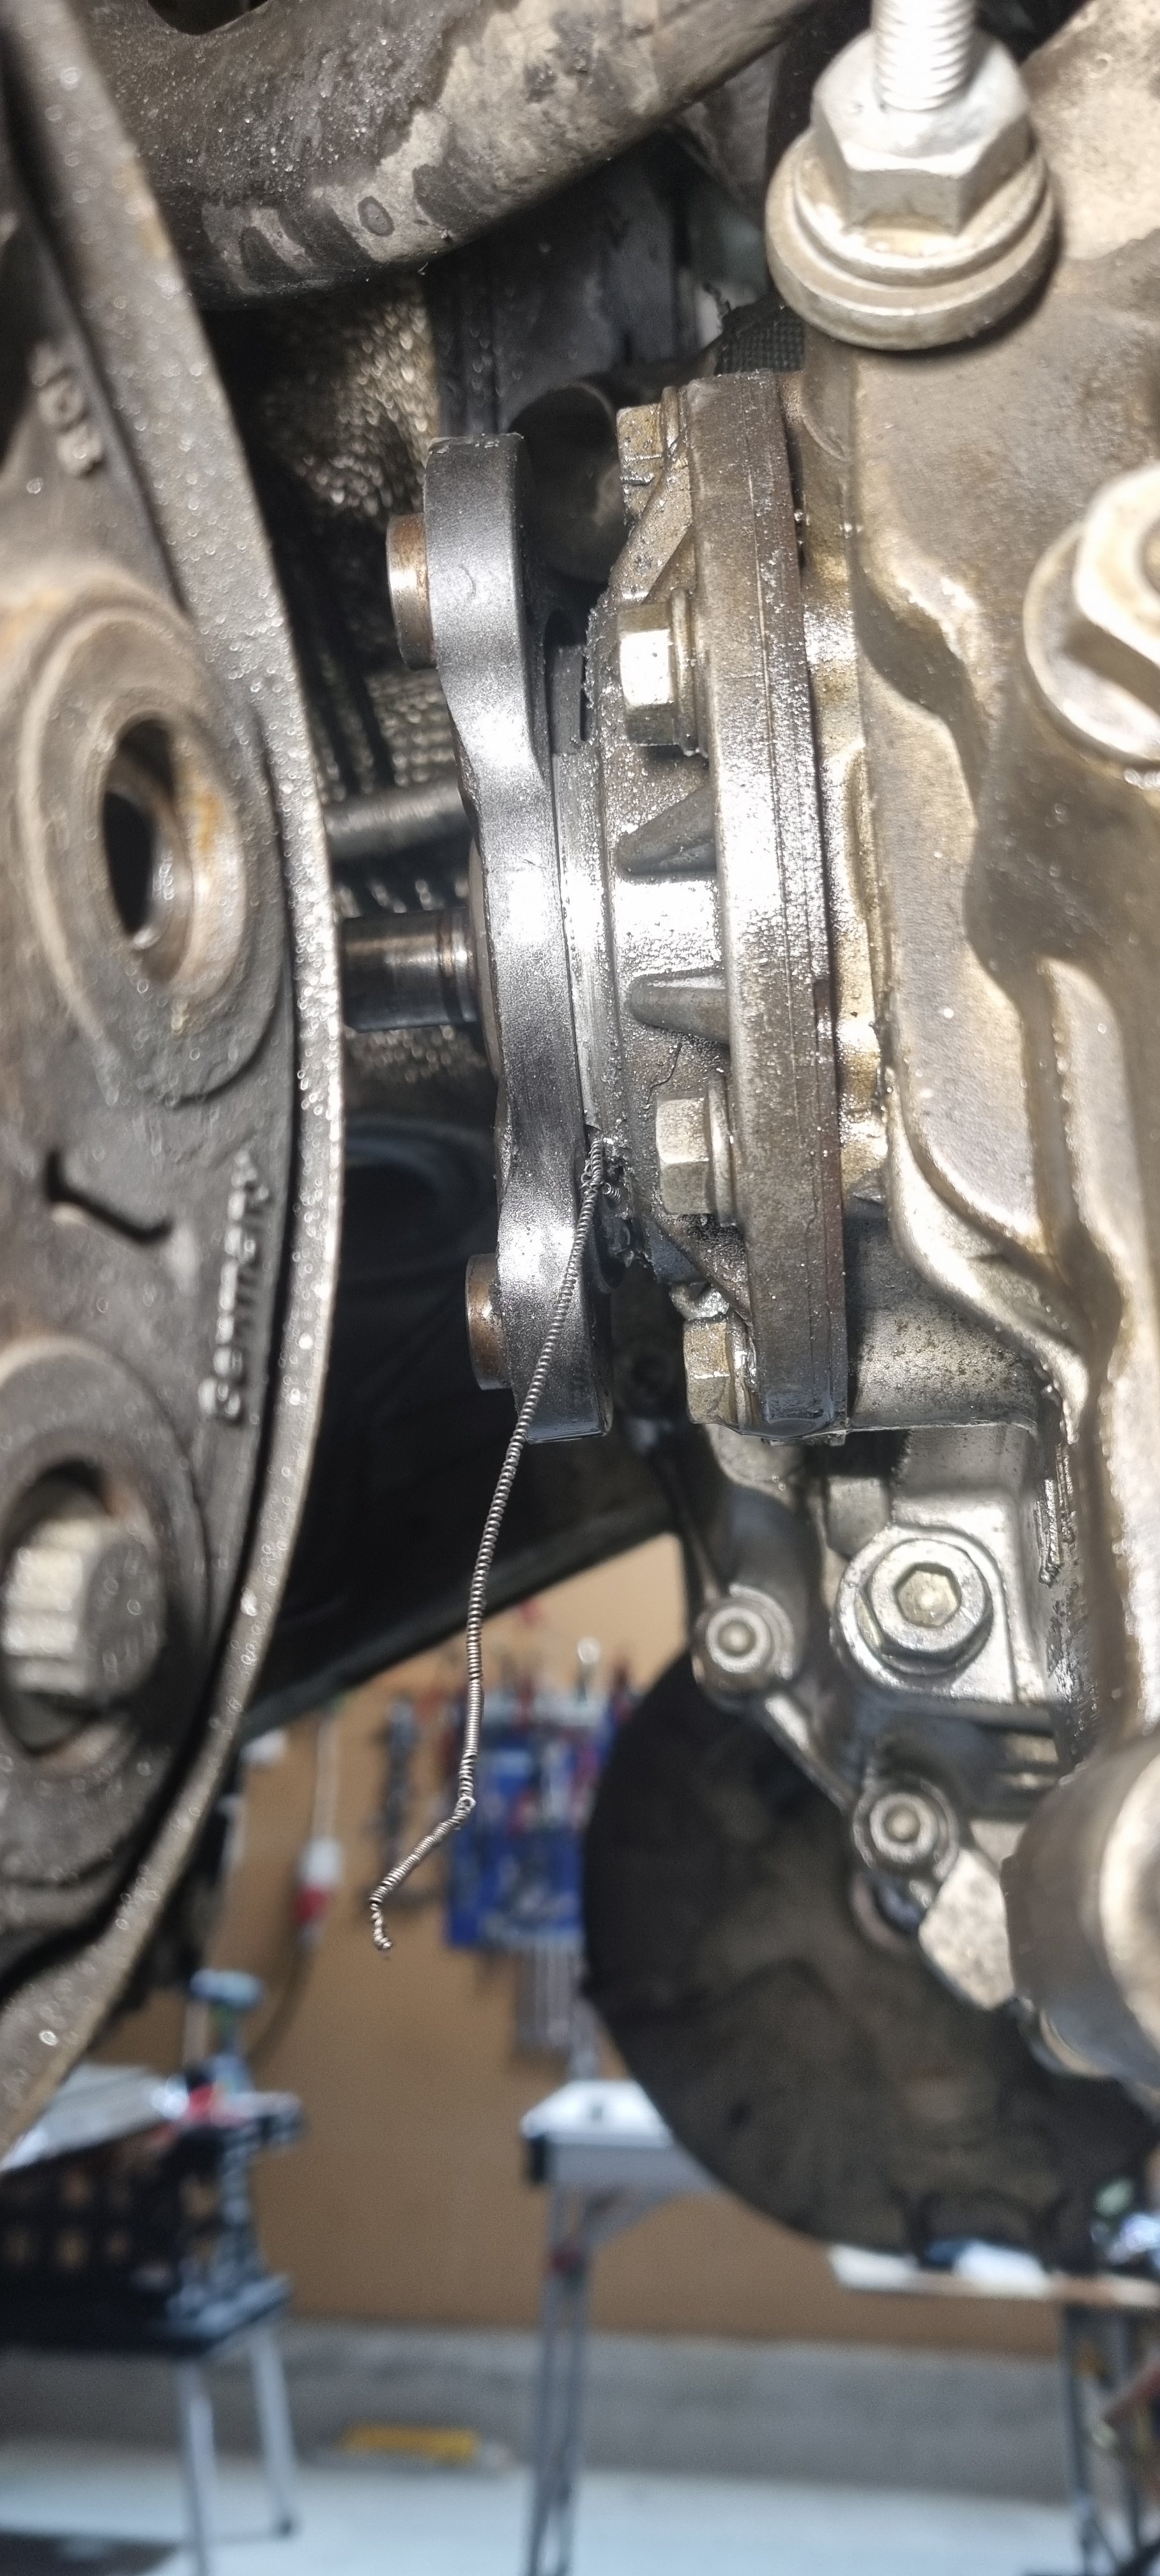
1 pointNew bevelbox/transmission arrived today. It was bolt on and after test drive, it is smooth!! To sum up, what tip is my best? Well, firstly, when working on transmission on a 4x4 tdi with DSG DQ250 and a webasto aux heater installed, 2 things really makes life easier. Take down the subframe. This gives you a lot of room. Take out DPF. With these 2 ****ers out, the rest is piece of cake. What tools saves money? Get a Sonic Insex 8mm ROUND head 140mm long. Partnumber: 83014008. This little ****er is a life saver!!! Buy locating guiding pins for the subframe. Using these will save you from doing a 4-wheel adjustment when subframe is assembled. Special tool partnumber is VW T10096. These are a no-brainer if you plan to do anything on your car infvolving subframe take-down. A looong 6mm hex bit socket, 355mm long. VW T10107A. This is used to undo the right bevelbox drive flange. On a DSG box, this has to come off in order to get the bracket loose. There is NO other way around it with tdi diesel and DSG DQ250 trans. Buy a Dremel like tool with metal cutter blades. Cut off the above mentioned famous bolt. Replace bolt with a shorter one, M10x1,5 threads. It is impossible to remove that on 2.0tdi with DSG DQ250 if not cut OR if you prefer to take down the whole DSG, be my guest, because that is what VW manual says. Cut it and replace, then remove bevelbox in-situ. Saves at least a couple of hours. Prybar. Use it to take out right bevelbox flange axle (goes all the way through the bevelbox) XZN (spline) 10 bits that has a 100mm long shaft. Makes it easier to take out 6 spline bolts on drive shaft. A lot easier actually. Good luck! So, my old bevelbox 0AV 409 053T is now garbage and the new slightly used (123 000km from 2014) 0AV 409 053AF is now operational. I estimate just replacement in situ to be approximately on my car is 4h of work on a scissor lift/lying on the floor. With 2 post lift a lot faster.

 1 point
 -
1 point1 point1 point1 point1.5 tsi. That was my choice but isn’t on your list. 40+ average mpg, very little maintenance required compared to a diesel. phev is pointless, you’re just buying an overly complex worst of both worlds vehicle.1 point1 pointUpdated today. New bevelbox/transmission box aquired from used carsale. Approx 300gbp shipping included. OE partn 0AV 409 053 AF. So starting today to take out and down the old bevelbox.
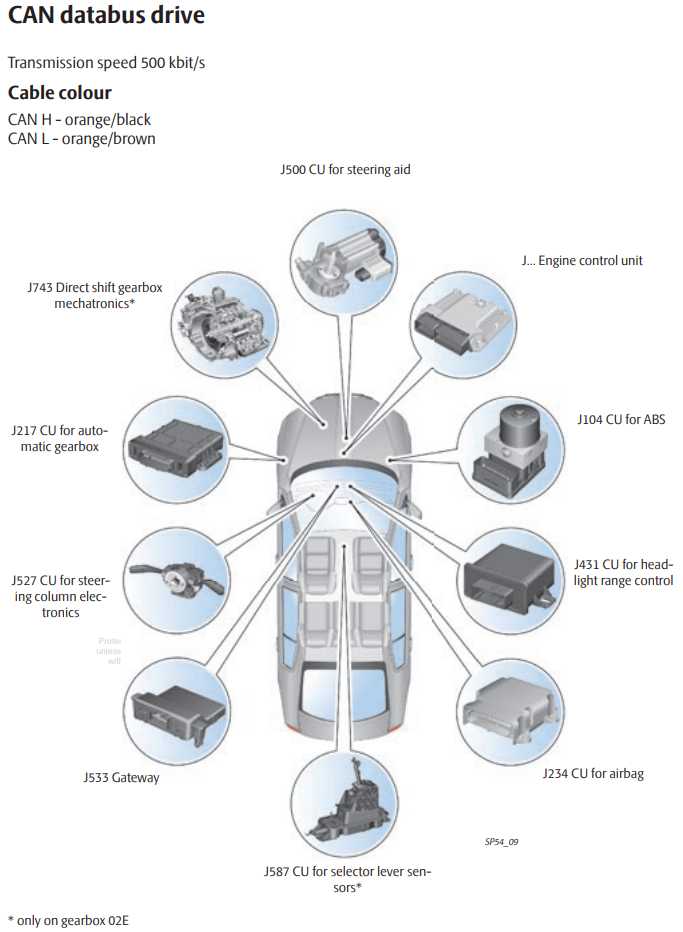
 1 point1 pointThat is a lot of 'can't be reached' faults. It does sound like the CAN communication is down as @langers2k says. Sometimes a single controller can broadcast rubbish on the network which can upset other controllers. Using VCDS you can usually look at the status of the CAN system and you may see something there. It will be under the live data and probably in the 'Cent Elec' controller. I think on your car you will need to click 'Advanced Measuring Blocks' and then look for 'CAN Status' in the pull down list. If that doesn't work because so much is down you may have to unplug one controller at a time as suggested to see if communication resumes. I notice the CAN gateway itself is working (and probably wondering why nobody will talk to it!) I have seen failing ABS controllers send the entire dash into a frenzy of wagging needles and winking lights.1 point1 pointSounds like you should grab some wiring diagrams etc from erwin as you probably need to check for power, ground and CAN at each of the modules on the drive CAN-bus. Very loose positions of the modules:
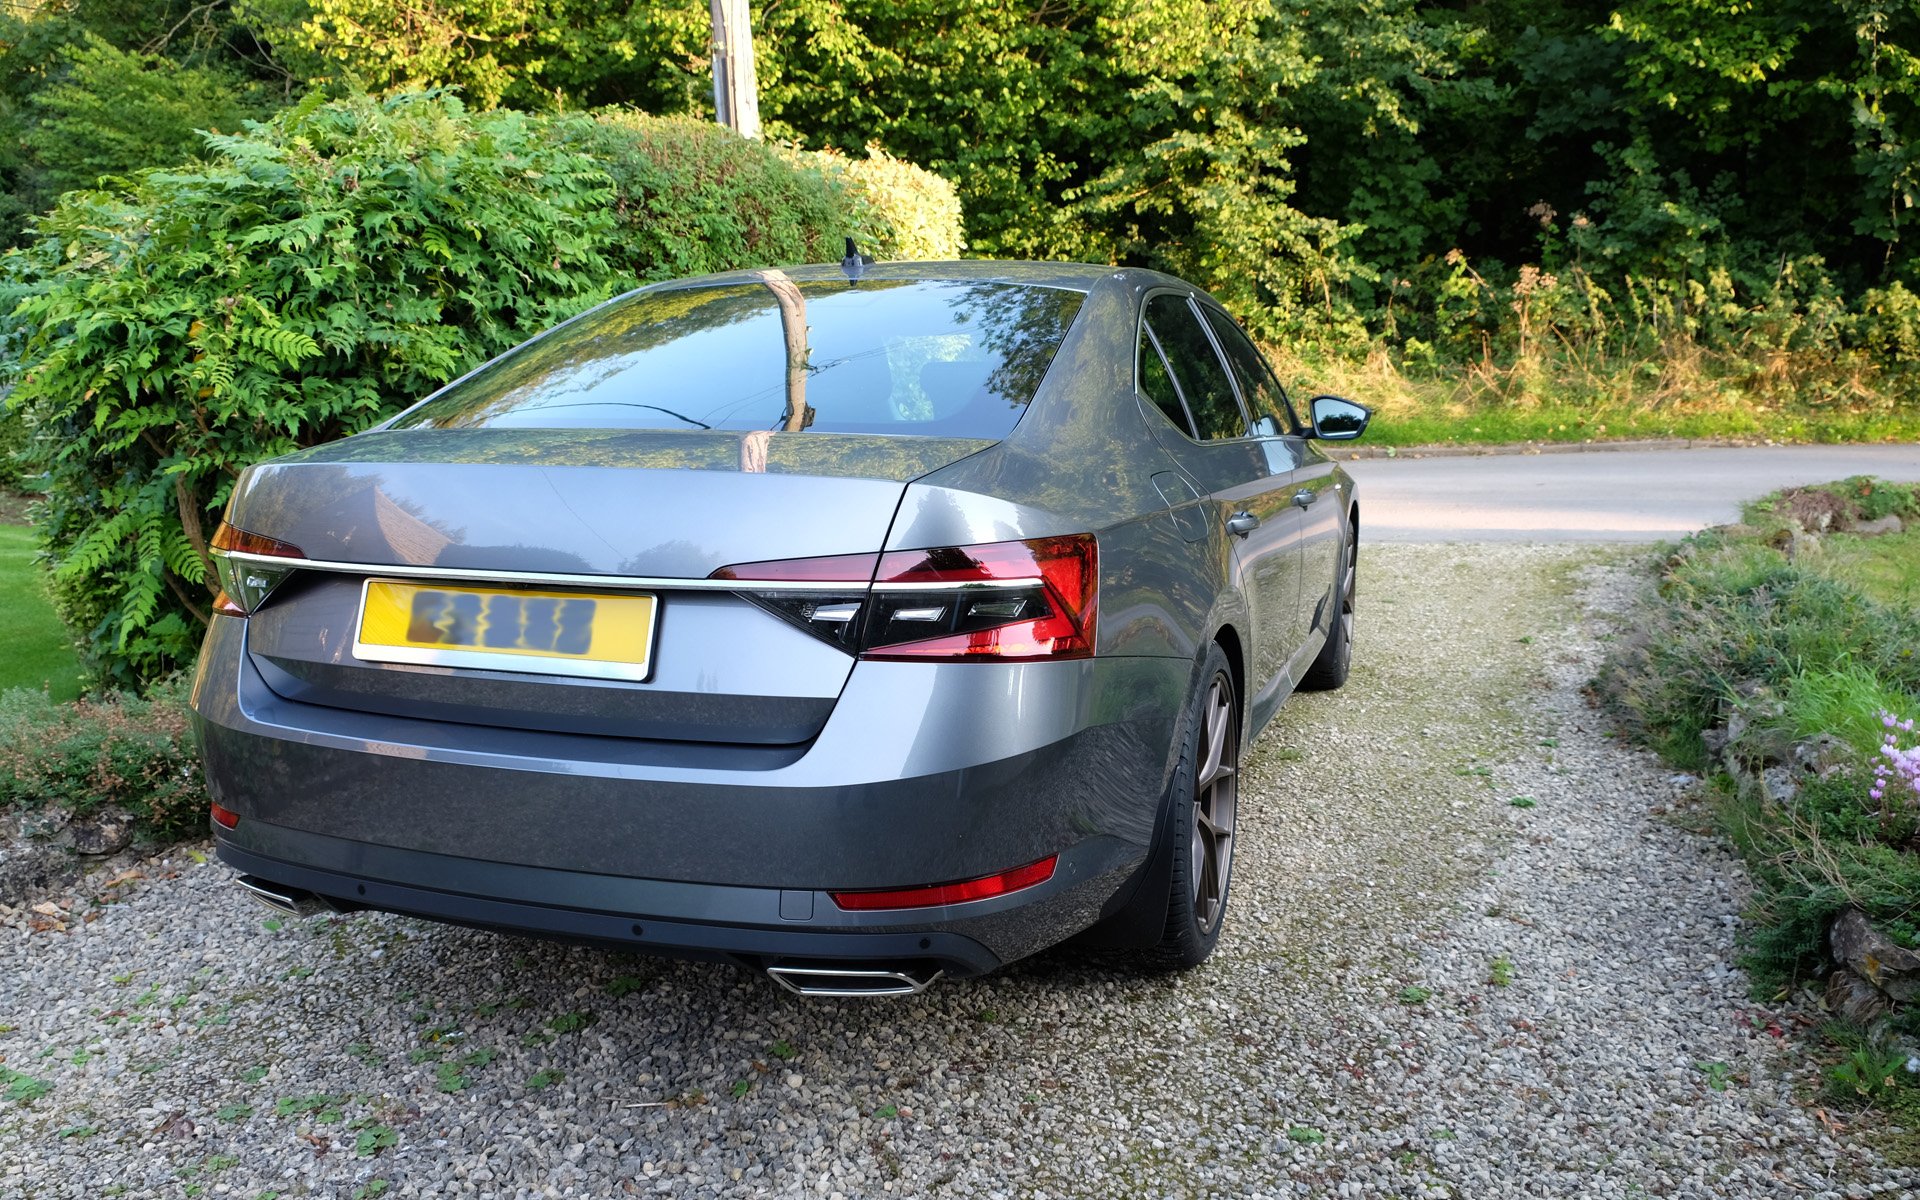
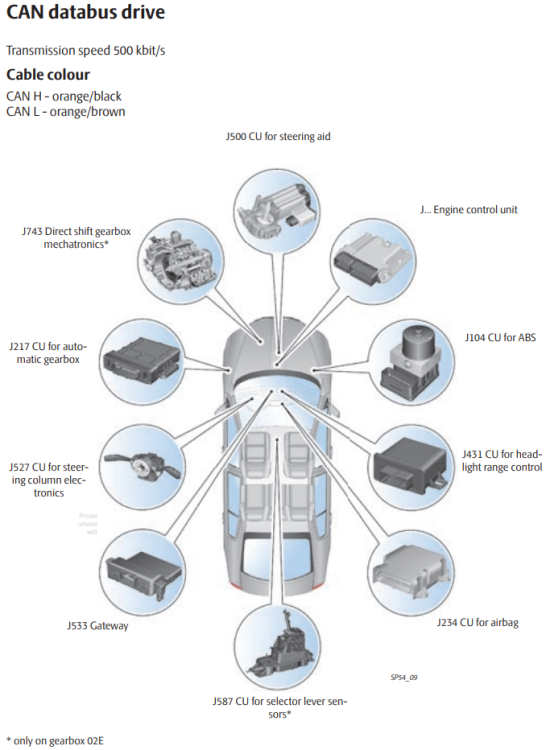 1 point1 pointFor Ref they are 8.0x19 ET34 with 235/40 tyres, pics below show where they sit in relation to the body a bit better. I de-badged the rear too, it maybe controversial but I prefer the clean look.
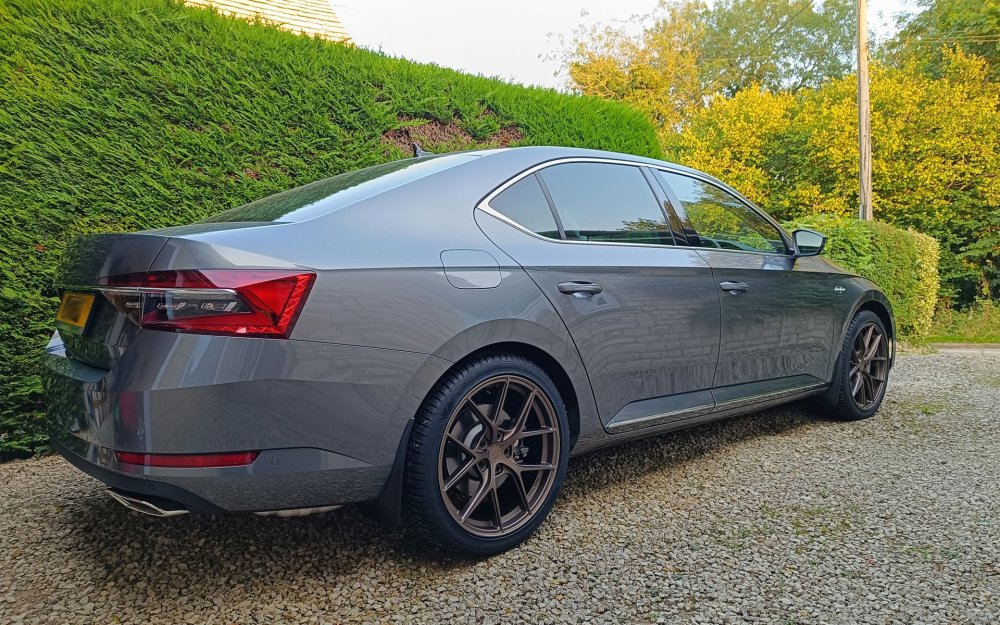
 1 pointThat’s interesting regarding Ohme. Mine often reports it’s lost its connection but we have great signal here. I’m moving to Octopus too as from Monday so will be interesting to see how that works out. I also find it irritating that I can’t set the charging schedule to start at an hour that I decide. we were told to get Ohme as it worked well with Skoda but as it can’t connect to my car’s data, it’s actually a bit useless.1 point1 pointBit late to be updating this thread, but for the benefit of anyone reading: @tunedude's suggestion of keeping the car on a battery maintainer would have got me through the cold snap & lockdown, the OEM battery wasn't totally dead on a VAG forum (someone else's thread re a Golf), a poster advised against DIY, saying that disconnecting the battery without an auxiliary supply would cause loss of memory for various settings, notably that the steering angle sensor would need re-setting afterwards. I found this to be true, steering felt looser afterwards but re-adjusted itself over a week or two. I learned later that this can be re-set by the owner, e.g. this guide or this guide. In the end I did code the car (but a good while after fitting the battery, and only out of curiosity). If you're coding when fitting a Yuasa YBX9096 battery, I used OBDEleven to do it: Gateway -> Adaptations -> Battery Adaptation BEM code: YG0 (that's a zero. This code wasn't easily found on the web) Enter figures for Ah and Serial# Select 'Fleece' as battery type (for AGM).1 point


.thumb.png.26e4ef1cd991d7943ece4e7bf5baf72f.png)


Important Information
Welcome to BRISKODA. Please note the following important links Terms of Use. We have a comprehensive Privacy Policy. We have placed cookies on your device to help make this website better. You can adjust your cookie settings, otherwise we'll assume you're okay to continue.